Global trade is being rebuilt around new rules, partners and risks. How can you determine where your risk exposure sits, so that you can explain strategic shifts in procurement, and sustainability decisions to your stakeholders?
Boards no longer ask whether trade fragmentation is real. They ask what it means for margin, market access and continuity, and whether management can see the next shock coming. Each business function is part of the bridge between strategy and operational execution: risk management owns the early-warning picture, procurement owns cost and continuity, and sustainability owns compliance and regulatory exposure.
Trade fragmentation is selective
Some media pundits have been presenting the current increase in trade risk as a retreat from globalisation, but there is evidence to suggest the opposite. As a recent UNCTAD report shows, global trade in goods and services exceeded USD35 trillion in 2025 and kept growing in 2026-H1. However, the geographical distribution of this is being reorganised: trade between the US and China fell by more than 20% in 2024-2025, while other East Asian countries gained. International trade continues, but is increasingly filtered by geoeconomic compatibility, most strongly in goods linked to technology, security and strategic dependence.
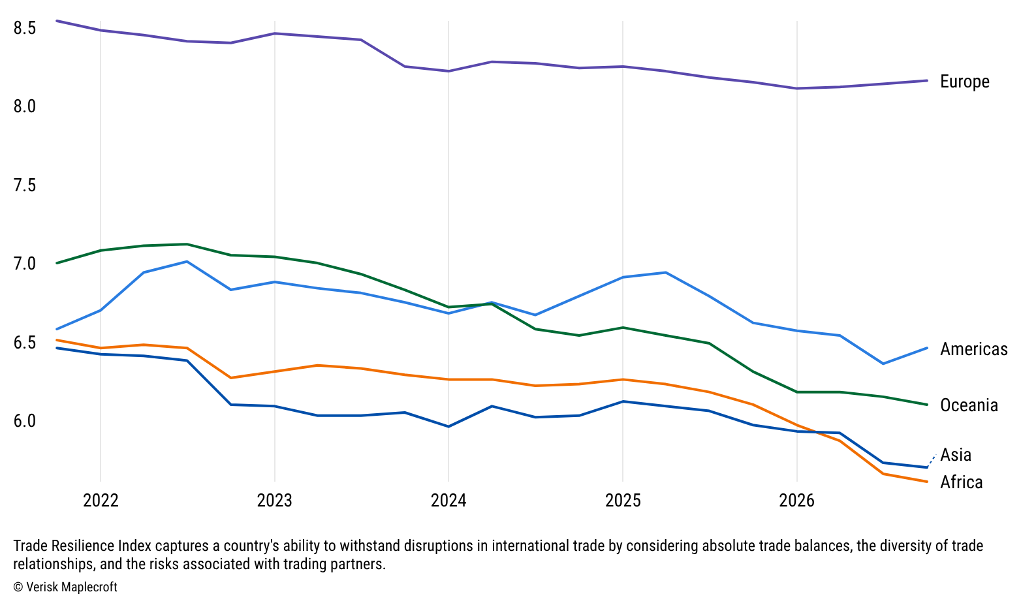
Aggregate resilience can mask weakening exposure underneath. Our Trade Resilience Index shows that resilience has deteriorated in 157 countries over the past five years, together accounting for more than 90% of global trade. While trade volumes continue to grow, the ability of individual countries, and the companies that depend on them, to absorb a shock has weakened.
Market access is also becoming more complex, with differentiation being shaped by policy. This includes the use of tariffs, technical and sanitary standards, rules of origin, export controls and due diligence laws – such as the US UFLPA, EU CSDDD and more. Tracking exposure to regulation and policy change has become as important as tracking supplier performance and quality.
Risk management teams: Build your case with continuous data intelligence
Trade measures are becoming more complex. Tariffs, product standards, rules of origin, export controls and due diligence laws increasingly arrive as overlapping packages, and our Supply Chain Risk Outlook finds that external risks are now more opaque, more interconnected and faster-moving than traditional frameworks were built to handle. For risk teams, that means mapping which instruments touch which inputs and markets, and prioritising inputs in the strategic categories where policy and security concerns converge, such as semiconductors, critical minerals, energy technologies, telecommunications and advanced manufacturing.
Our new trade indices, released in 2026, add a country-level view of the same problem. Combined with other indices from our Country Risk Data, they can alert risk teams to where economic risk is rising across the operating footprint, and support more confident decisions on market entry and operational continuity. Where trade concentration and dependency create hidden vulnerability, the time to find out is before disruption forces a decision.
The Trade Exposure Index measures a country's dependence on foreign trade and its vulnerability to global market shocks, using goods trade-to-GDP ratios and global trade shares. The Trade Resilience Index looks at the composition of that trade: how dependent a country is on trade, and how diverse and stable its trading partners are. The most resilient profiles are built on diversity, in the goods exchanged and in the partners involved, while a country that leans on a few partners or on unstable trade regimes is more exposed to disruption.
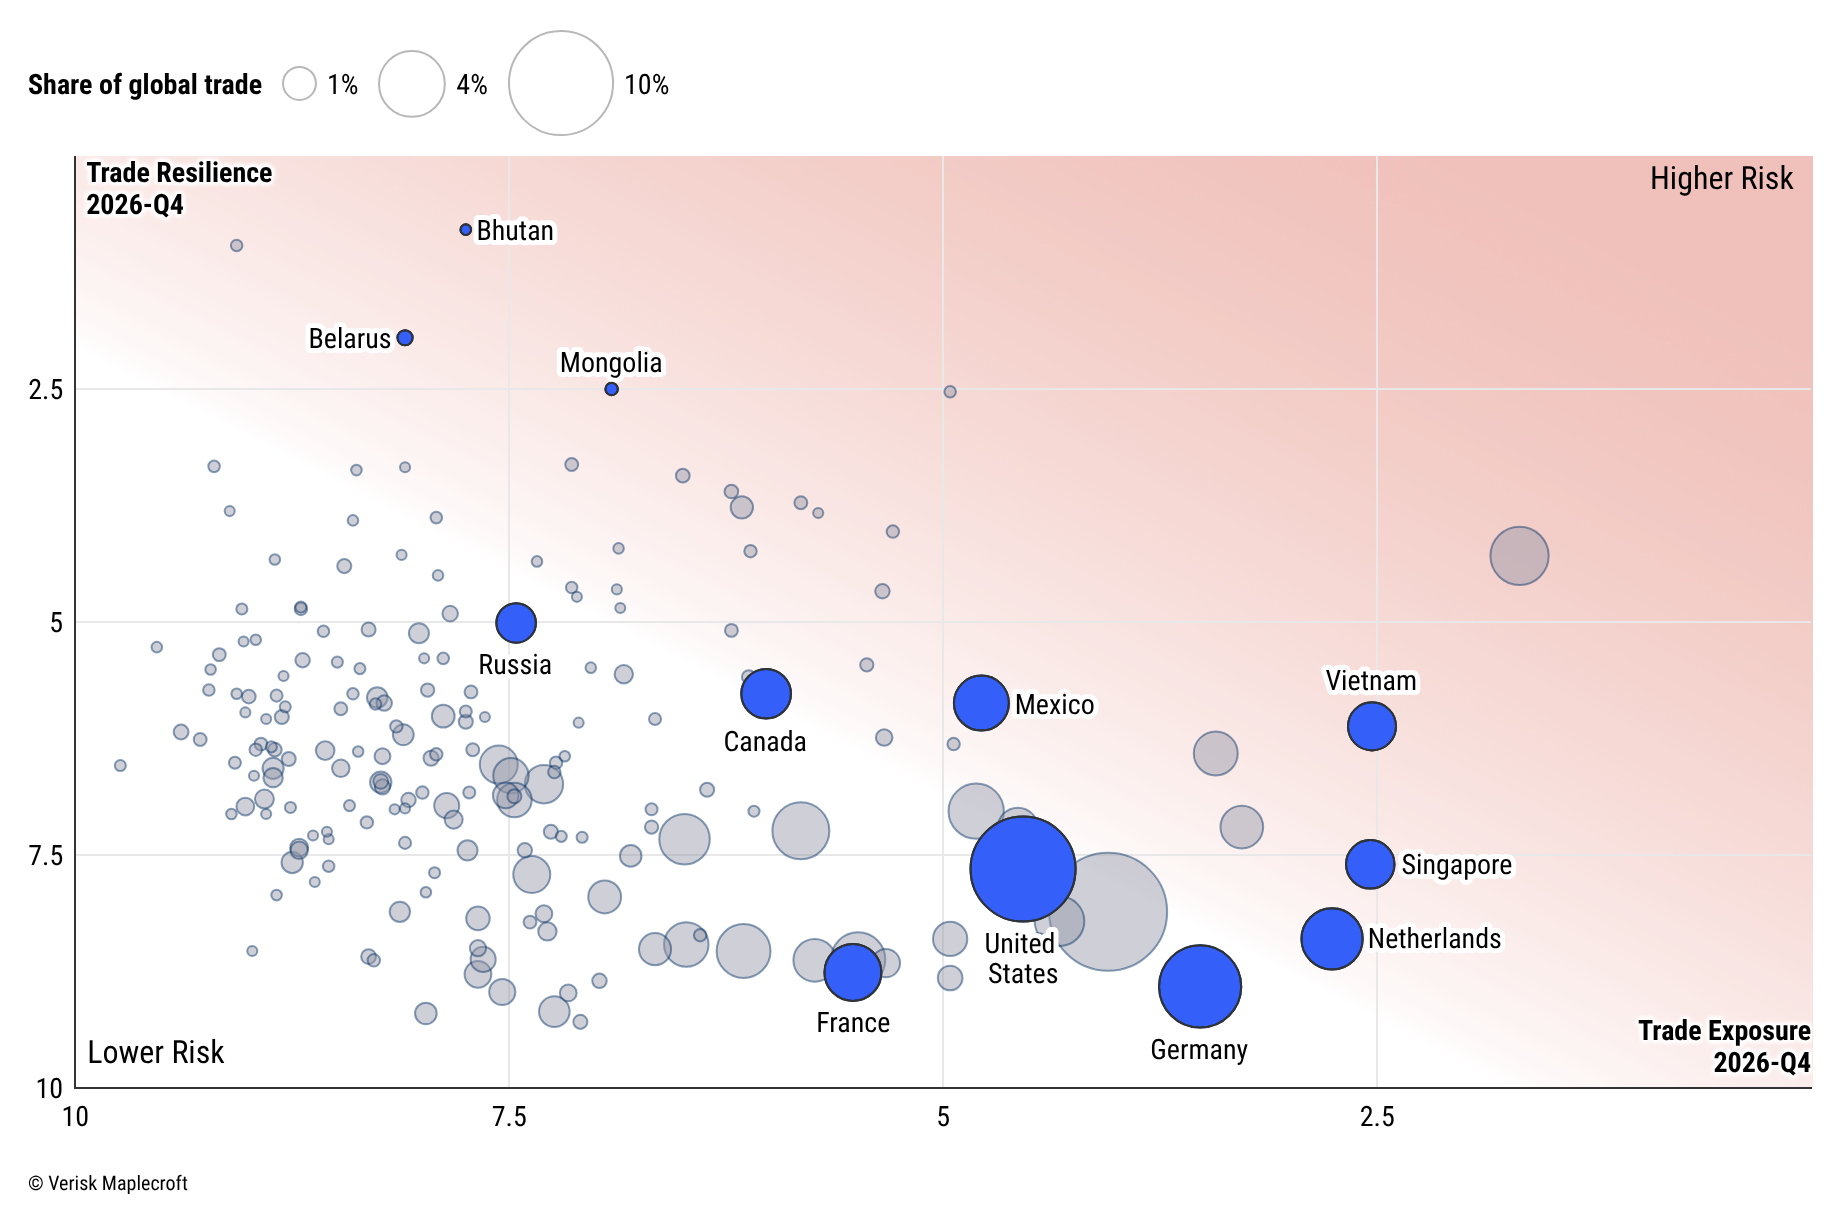
Read together, they show that deep trade integration cuts both ways: hubs such as Singapore and the Netherlands gain from global flows but are more exposed to a crisis, port strike or tariff shift elsewhere. They also separate markets that can look alike: Vietnam is now the fourth highest-risk economy for trade resilience, while Brazil’s large domestic market keeps its exposure low. For boards, this offers a simple, comparable way to see why a market that looks strong on growth can still carry hidden risk.
Procurement and supply chain teams: lead with cost and continuity
Your stakeholders hear about suppliers and lead times – but they need to hear about margins and continuity. Tariffs on intermediate inputs often raise costs for downstream firms, encourage trade diversion and push companies to redesign sourcing. Frame exposure that way: input-cost and supplier-concentration risk, and the inventory buffer needed to cover reliance on a few ports, routes or partners.
According to UNCTAD’s 2026 Trade and Development Report, there is little evidence of widespread nearshoring; companies are instead diversifying suppliers, building redundancy and relocating selectively. In our “rising stars” analysis earlier this year, we argue that Thailand, the Philippines, Argentina, Chile and Uruguay show improving trajectories on market openness, regulatory strength and labour rights, while risks in established hubs such as Vietnam, Malaysia, Mexico and Brazil are increasing.
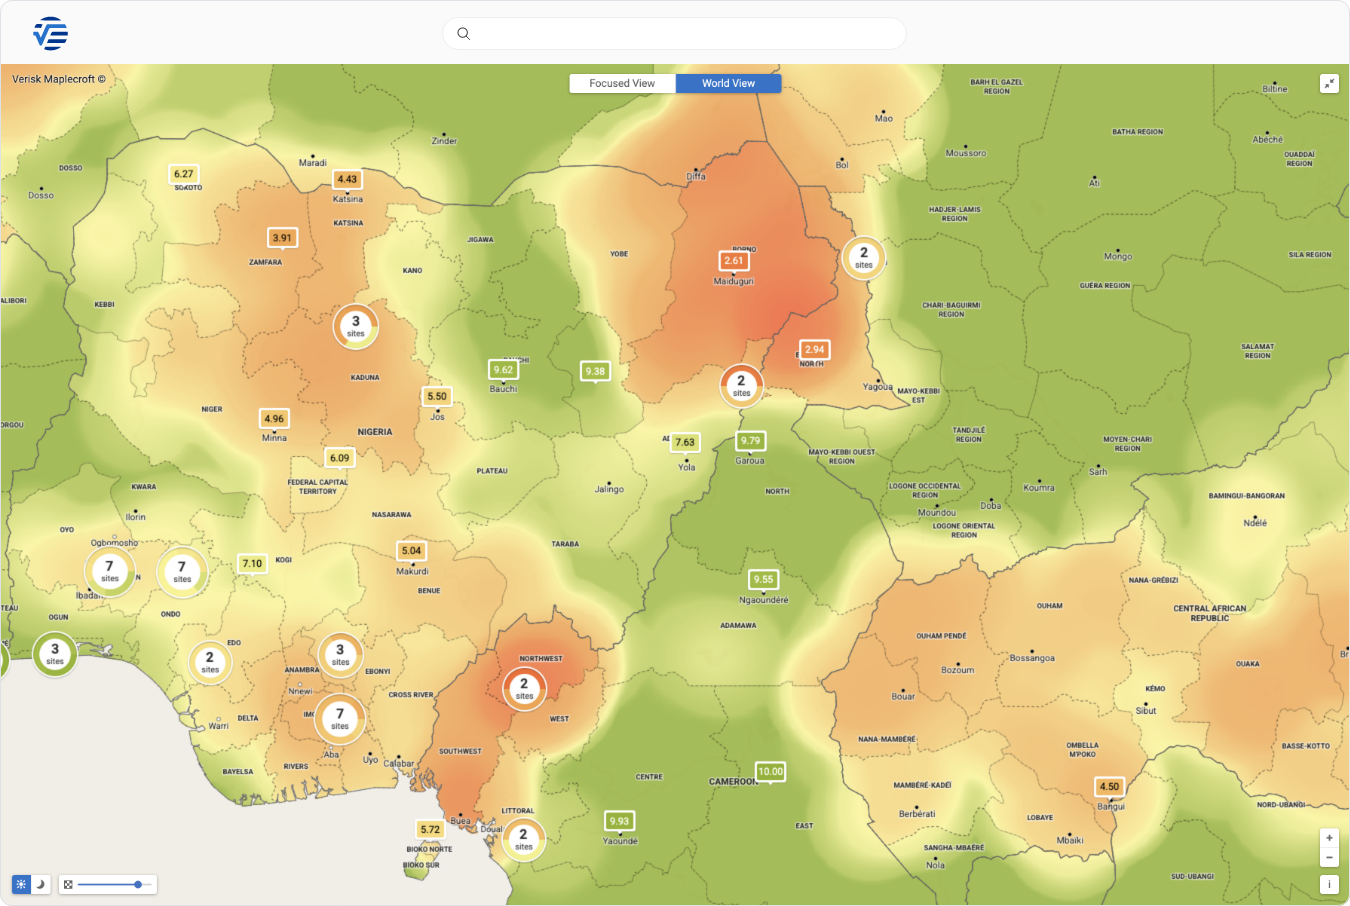
Show the nodes, not just the countries. Upload your supplier site locations to GRiD, and your key logistics hubs like ports and airports, so that risk scores can reflect the exact locations that your business actually depends on. Our trade indices help identify sourcing locations with more diversified and reliable trade networks, and they can reveal risks that cost and capacity comparisons miss.
Sustainability teams: make it a market-access story
Trade policy is increasingly used to pursue social and environmental goals, including carbon border measures such as CBAM, due diligence laws, labour-related import restrictions and deforestation rules. Businesses may face market exclusion not because their production is non-compliant, but because they cannot document compliance in the required form. For sustainability teams, that turns traceability and evidence into a commercial asset, and it is the argument for funding them.
Forced labour is a sharp example in 2026. Stakeholders may assume ESG pressure is receding, yet enforcement is increasingly driven by trade policies that do not map cleanly to supplier-level risk. In early 2026, the US launched forced labour investigations into 60 economies, including the EU, UK and Canada, creating a basis for tiered double-digit tariffs. Move the board question from "Where do we have forced labour risk?" to "Which enforcement event is most likely, what would it cost us, and how quickly could we respond?" Our Forced Labour Index, read alongside the Geopolitical Relations Index, can potentially separate labour risk from enforcement likelihood, as we explore in our forced labour research.
Make the numbers stand up to scrutiny
Whichever part of the business is briefing the board, investors, or other stakeholders – three actions can improve your credibility:
- Agreement on a single source of truth, and one set of numbers. Financial framing with finance teams is often a good idea before anything reaches the board.
- Use historical data to build a risk trajectory for key sites and regions. Base your reporting, forecasting and investment decisions on proven data trends.
- Country-wide scores are not company exposure: overlay them on your own sites, inputs and key logistics nodes in GRiD – and define to stakeholders whether a score is national or subnational.
Not every shock can be predicted, but informed stakeholder decisions – guided by the clearest view of external risk – limit the damage before it cascades through business operations. Explore our Global Risk Data and find out how it can strengthen your sourcing, sustainability and risk decisions: get in touch today.