Throughout 2025, our in-house experts used maps and charts drawn from our suite of Country Risk Data to make sense of a rapidly evolving global risk environment.
We mapped the state of global democracy after a packed year of elections, assessed how resource nationalism is reshaping the scramble for critical minerals, and analysed heat-related risks facing the data centres powering the AI boom. As geopolitical tensions forced organisations to take a closer look at their global operations, we examined labour costs and human capital availability in key supply chain locations, as well as rising security risks in the world’s major logistics hubs.
We closed out the year with our Political Risk Outlook, exploring the trends driving political risk globally and how these are likely to evolve in 2026 and beyond.
Below, we’ve selected 10 of our favourite data visualisations from a standout year of analysis.
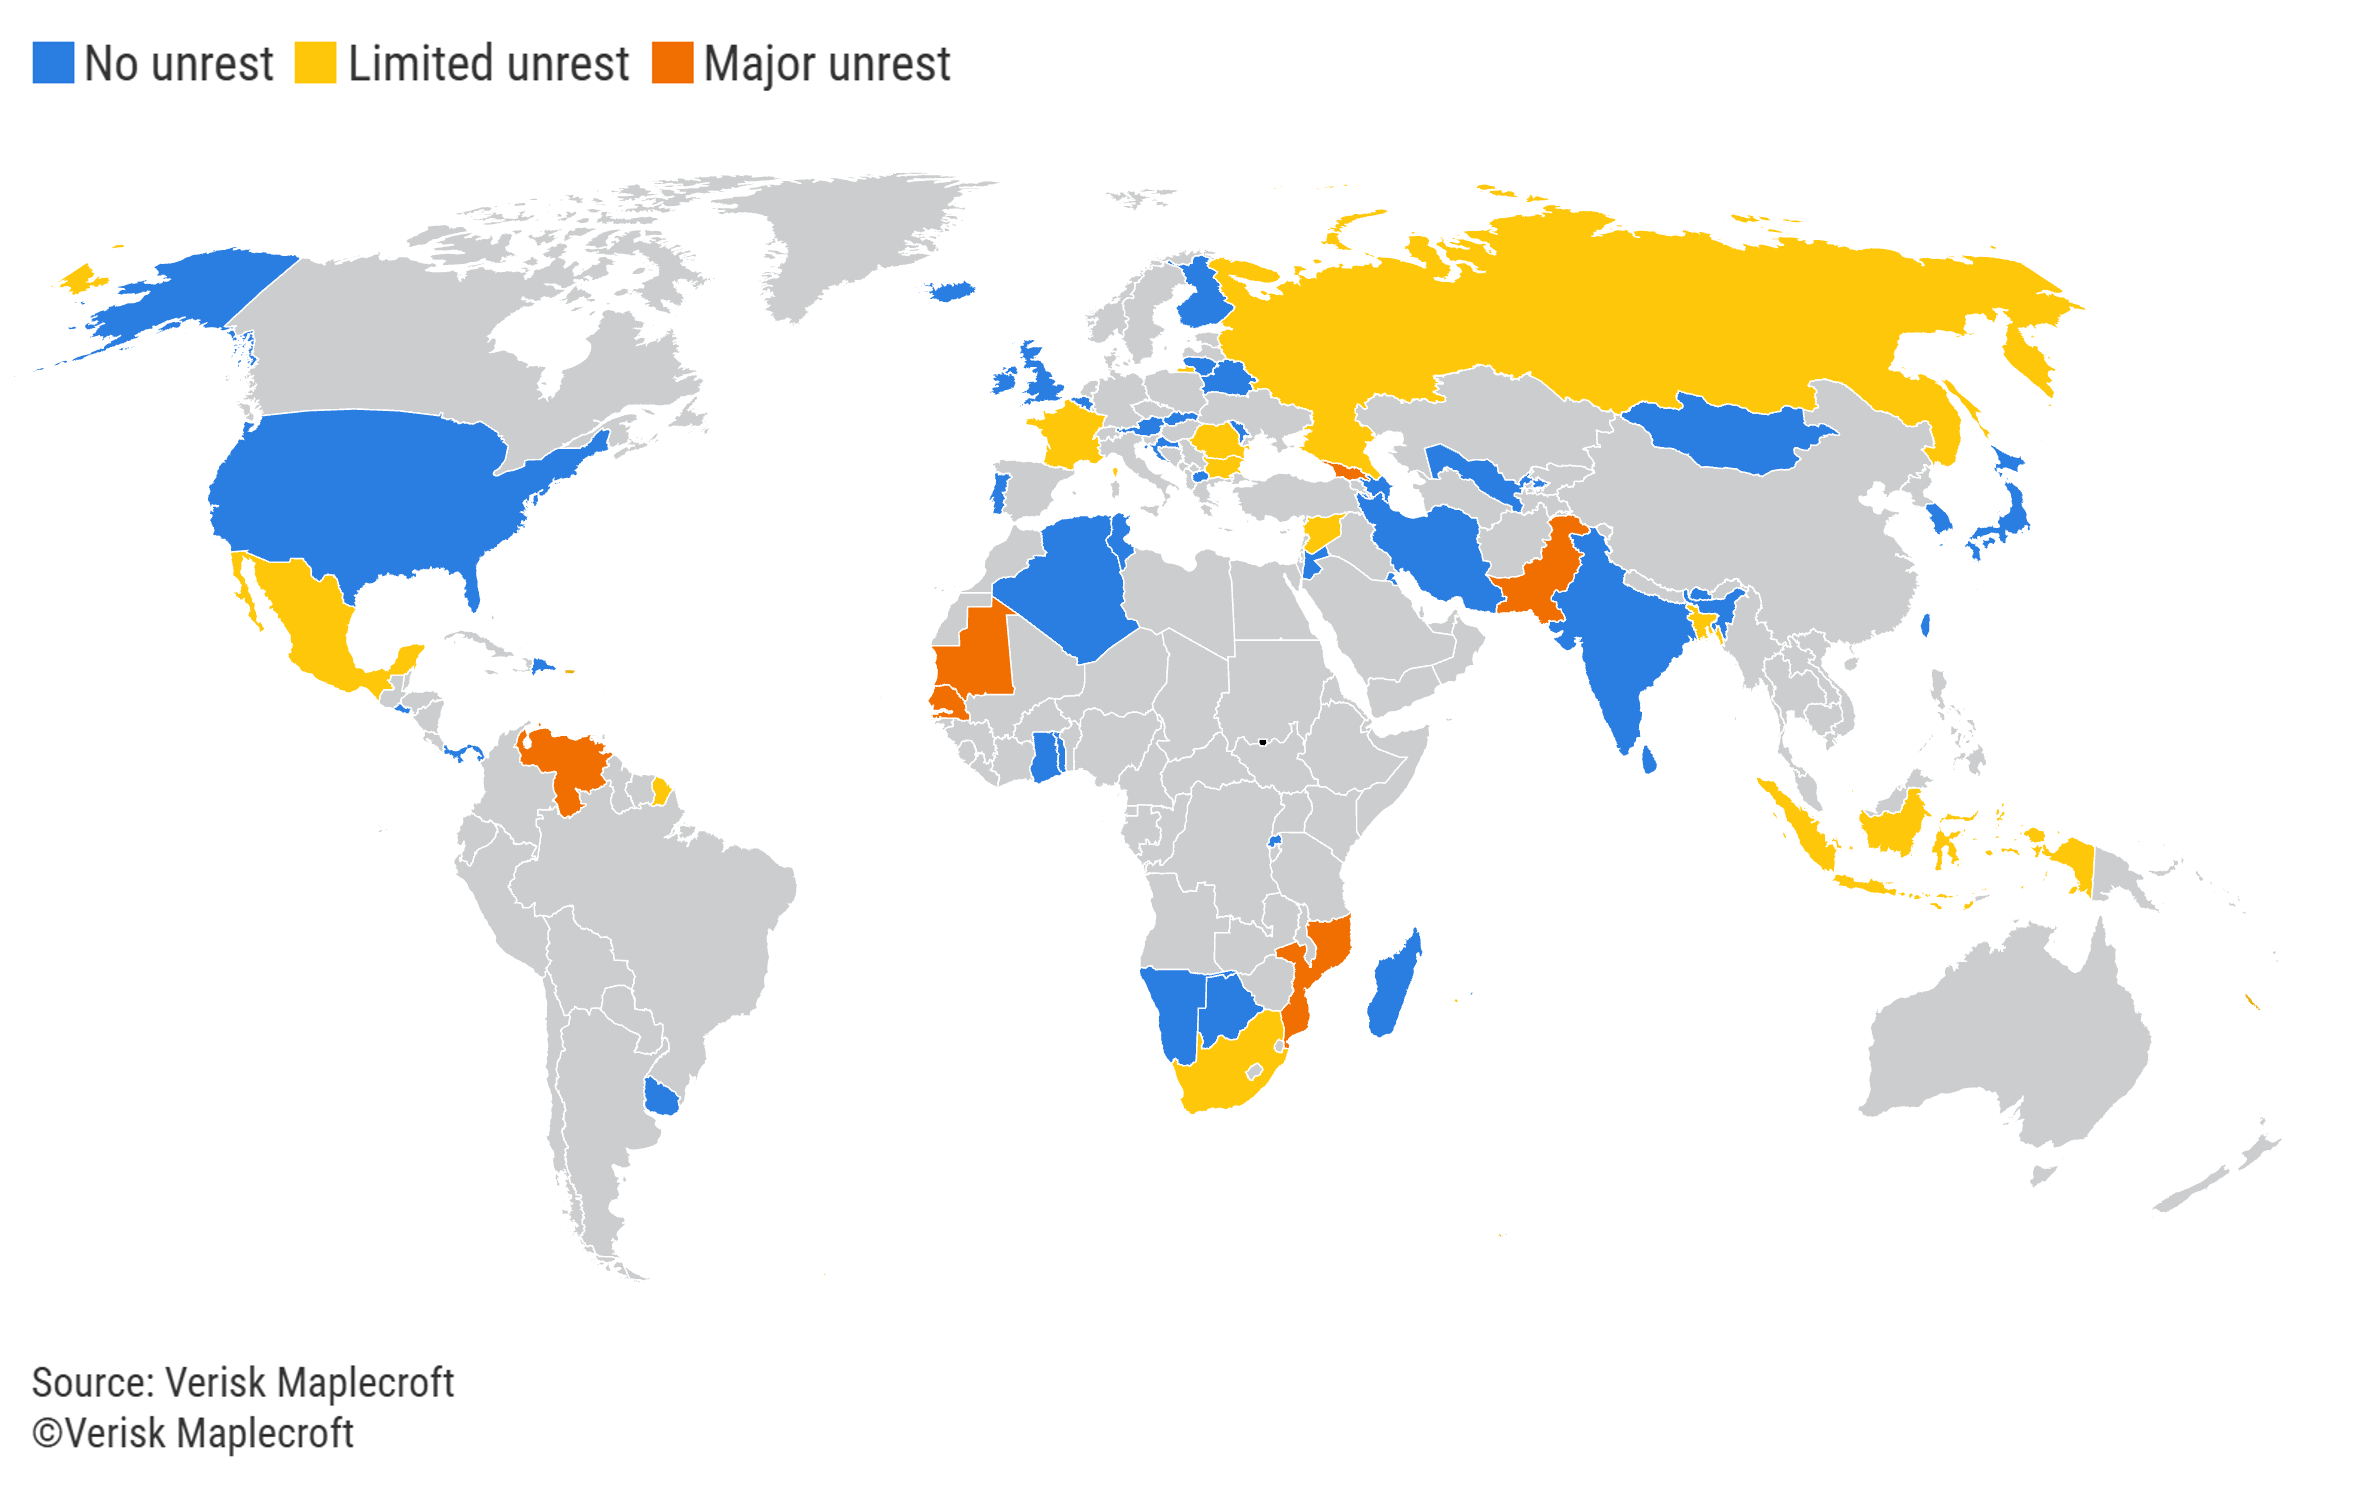
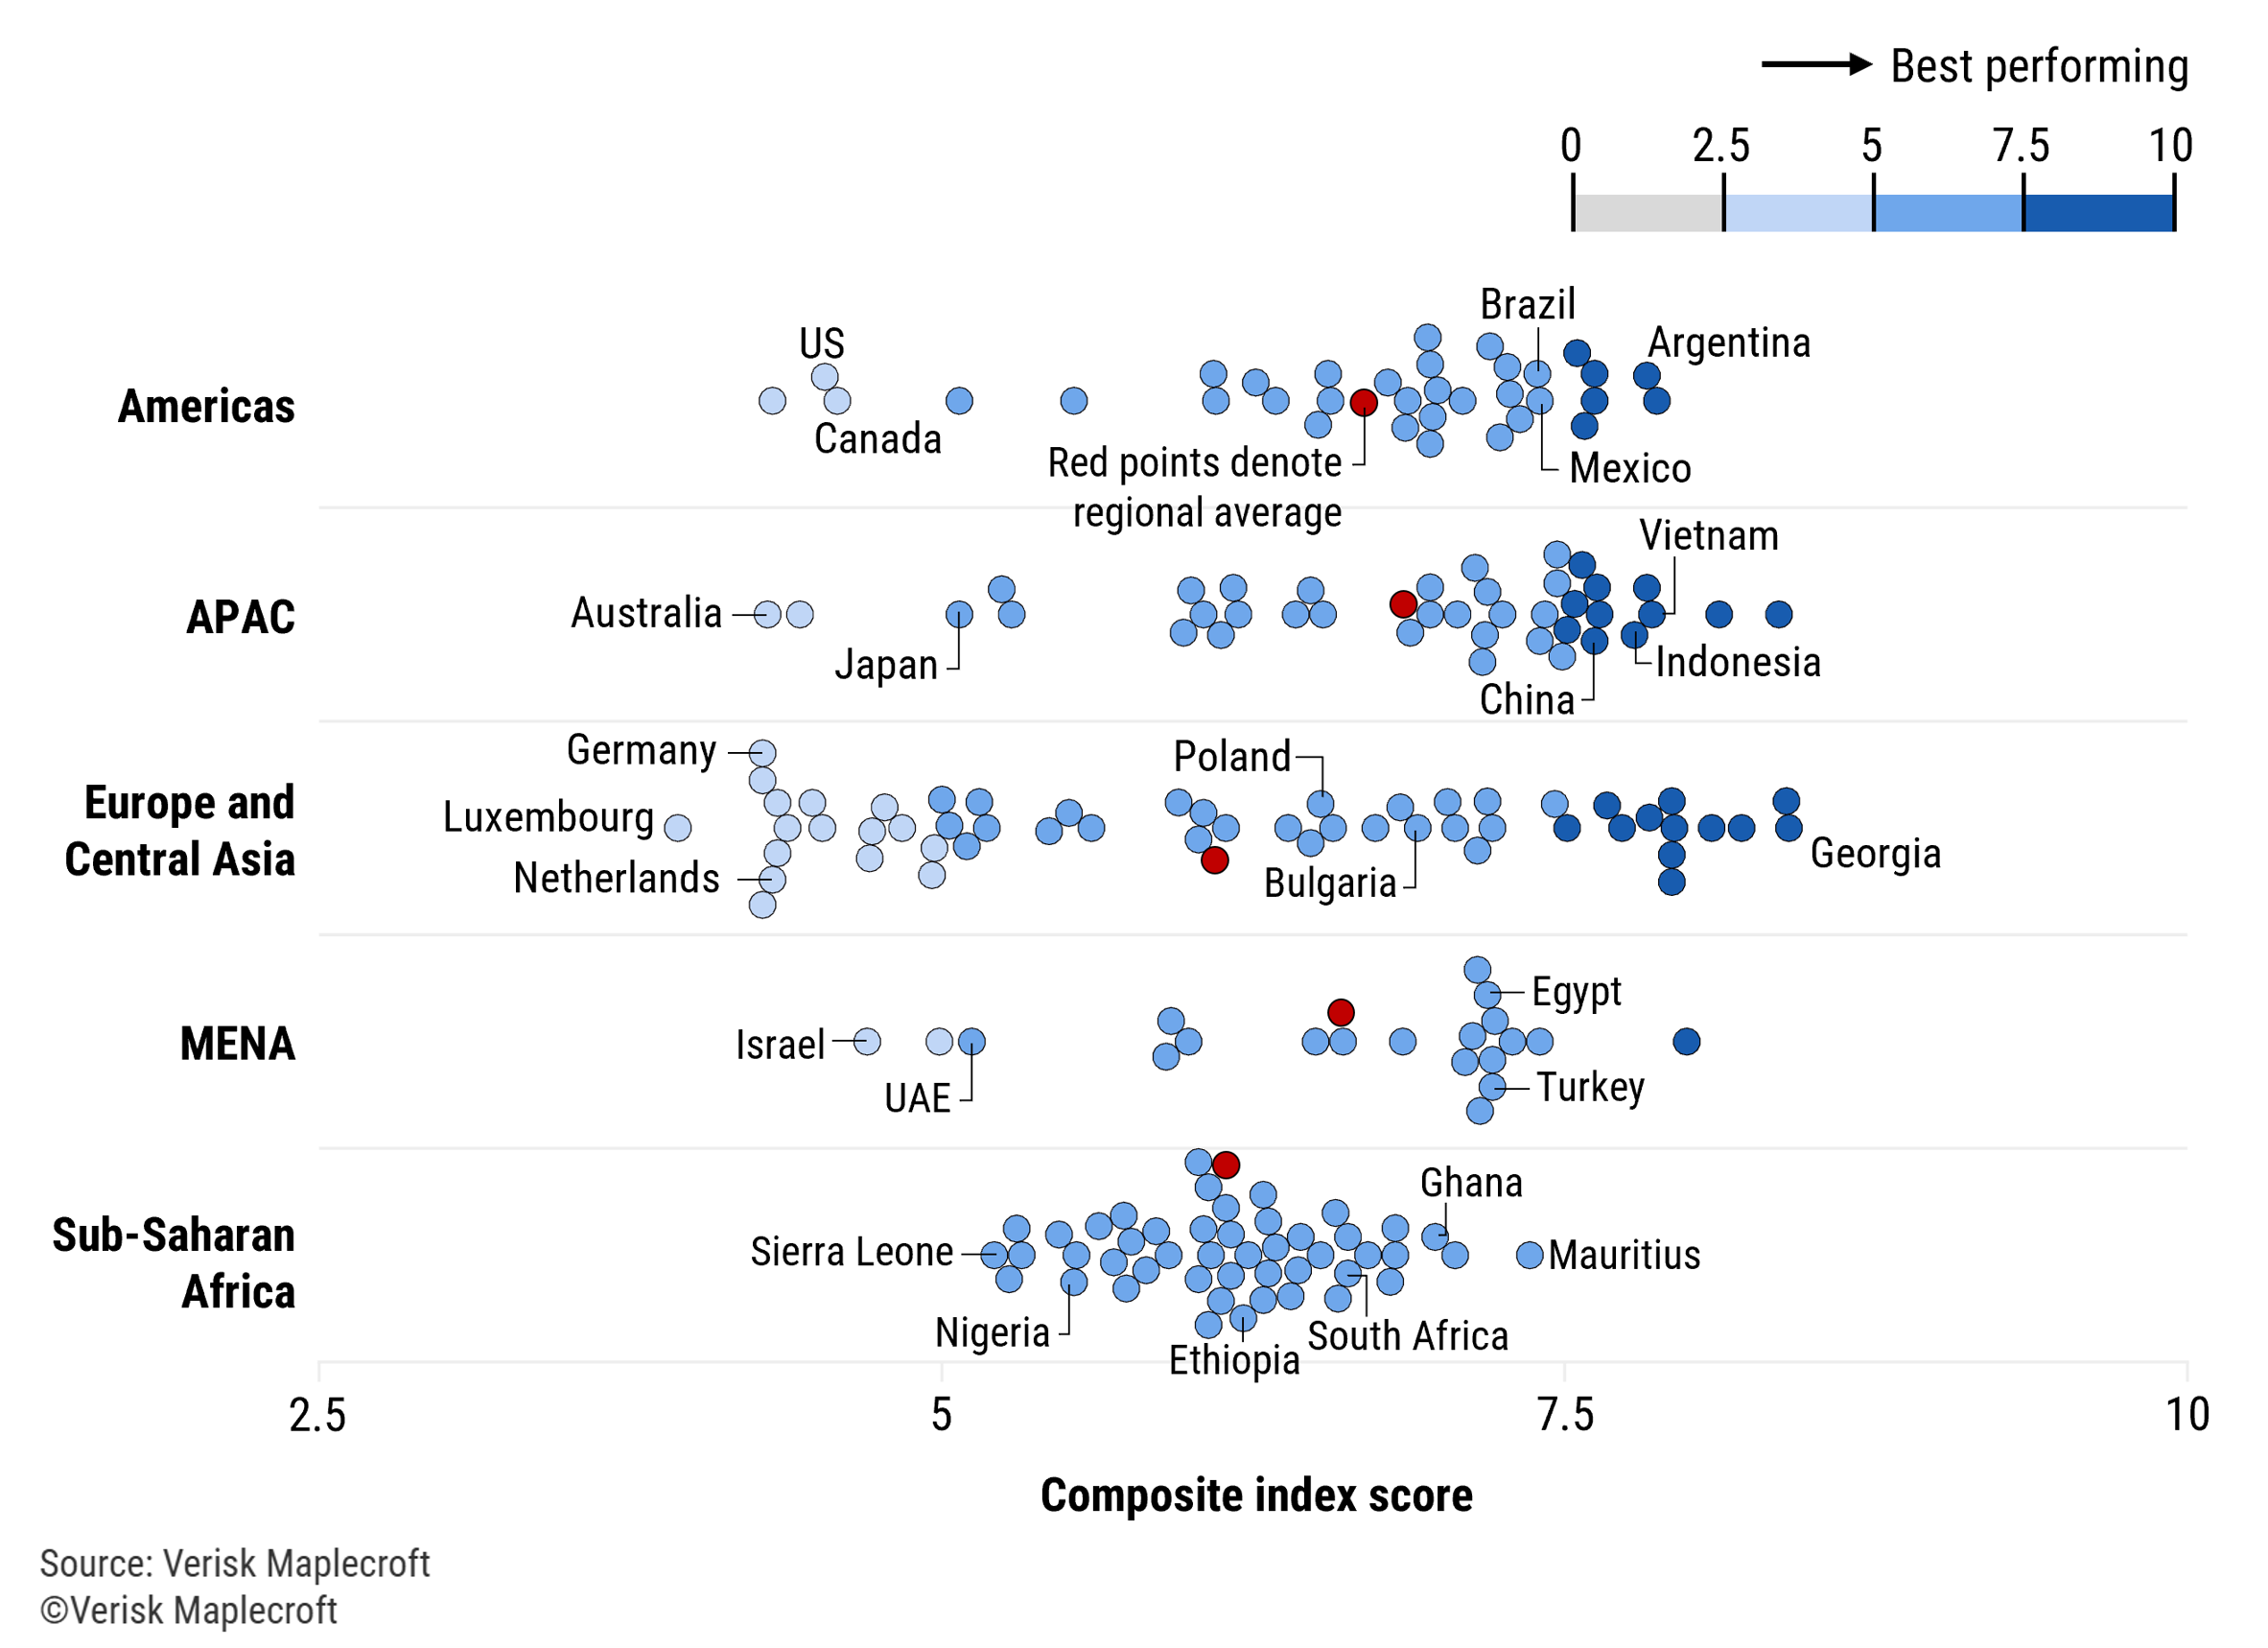
We began the year by examining data from our Democratic Governance and Civil Unrest indices in the wake of 2024’s electoral ‘supercycle’. While elections are often framed as flashpoints for violence, our analysis shows that election-related civil unrest is uncommon when votes are competitive.
Read our analysis: Global democracy delivered change in 2024 – this year will be no different
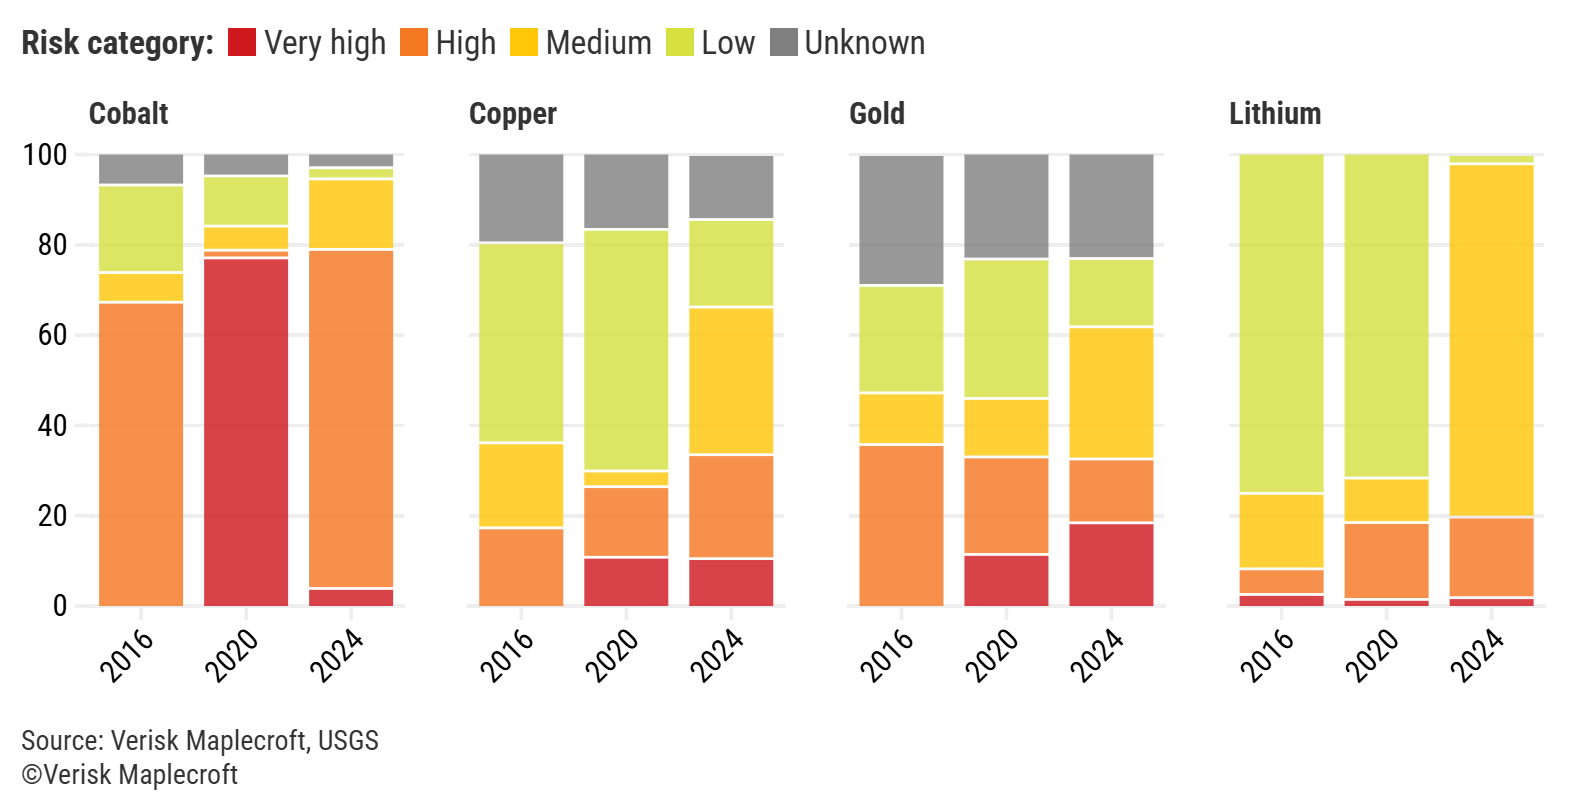
Competition over vital raw materials climbed up the geopolitical agenda in 2025. The chart above shows that this trend has coincided with a steady increase in resource nationalism among major emerging market mineral producers, raising the potential for disruption to the supply of materials for the renewables, tech and defence industries.
Read our analysis: Emerging markets exerting more control over strategic minerals
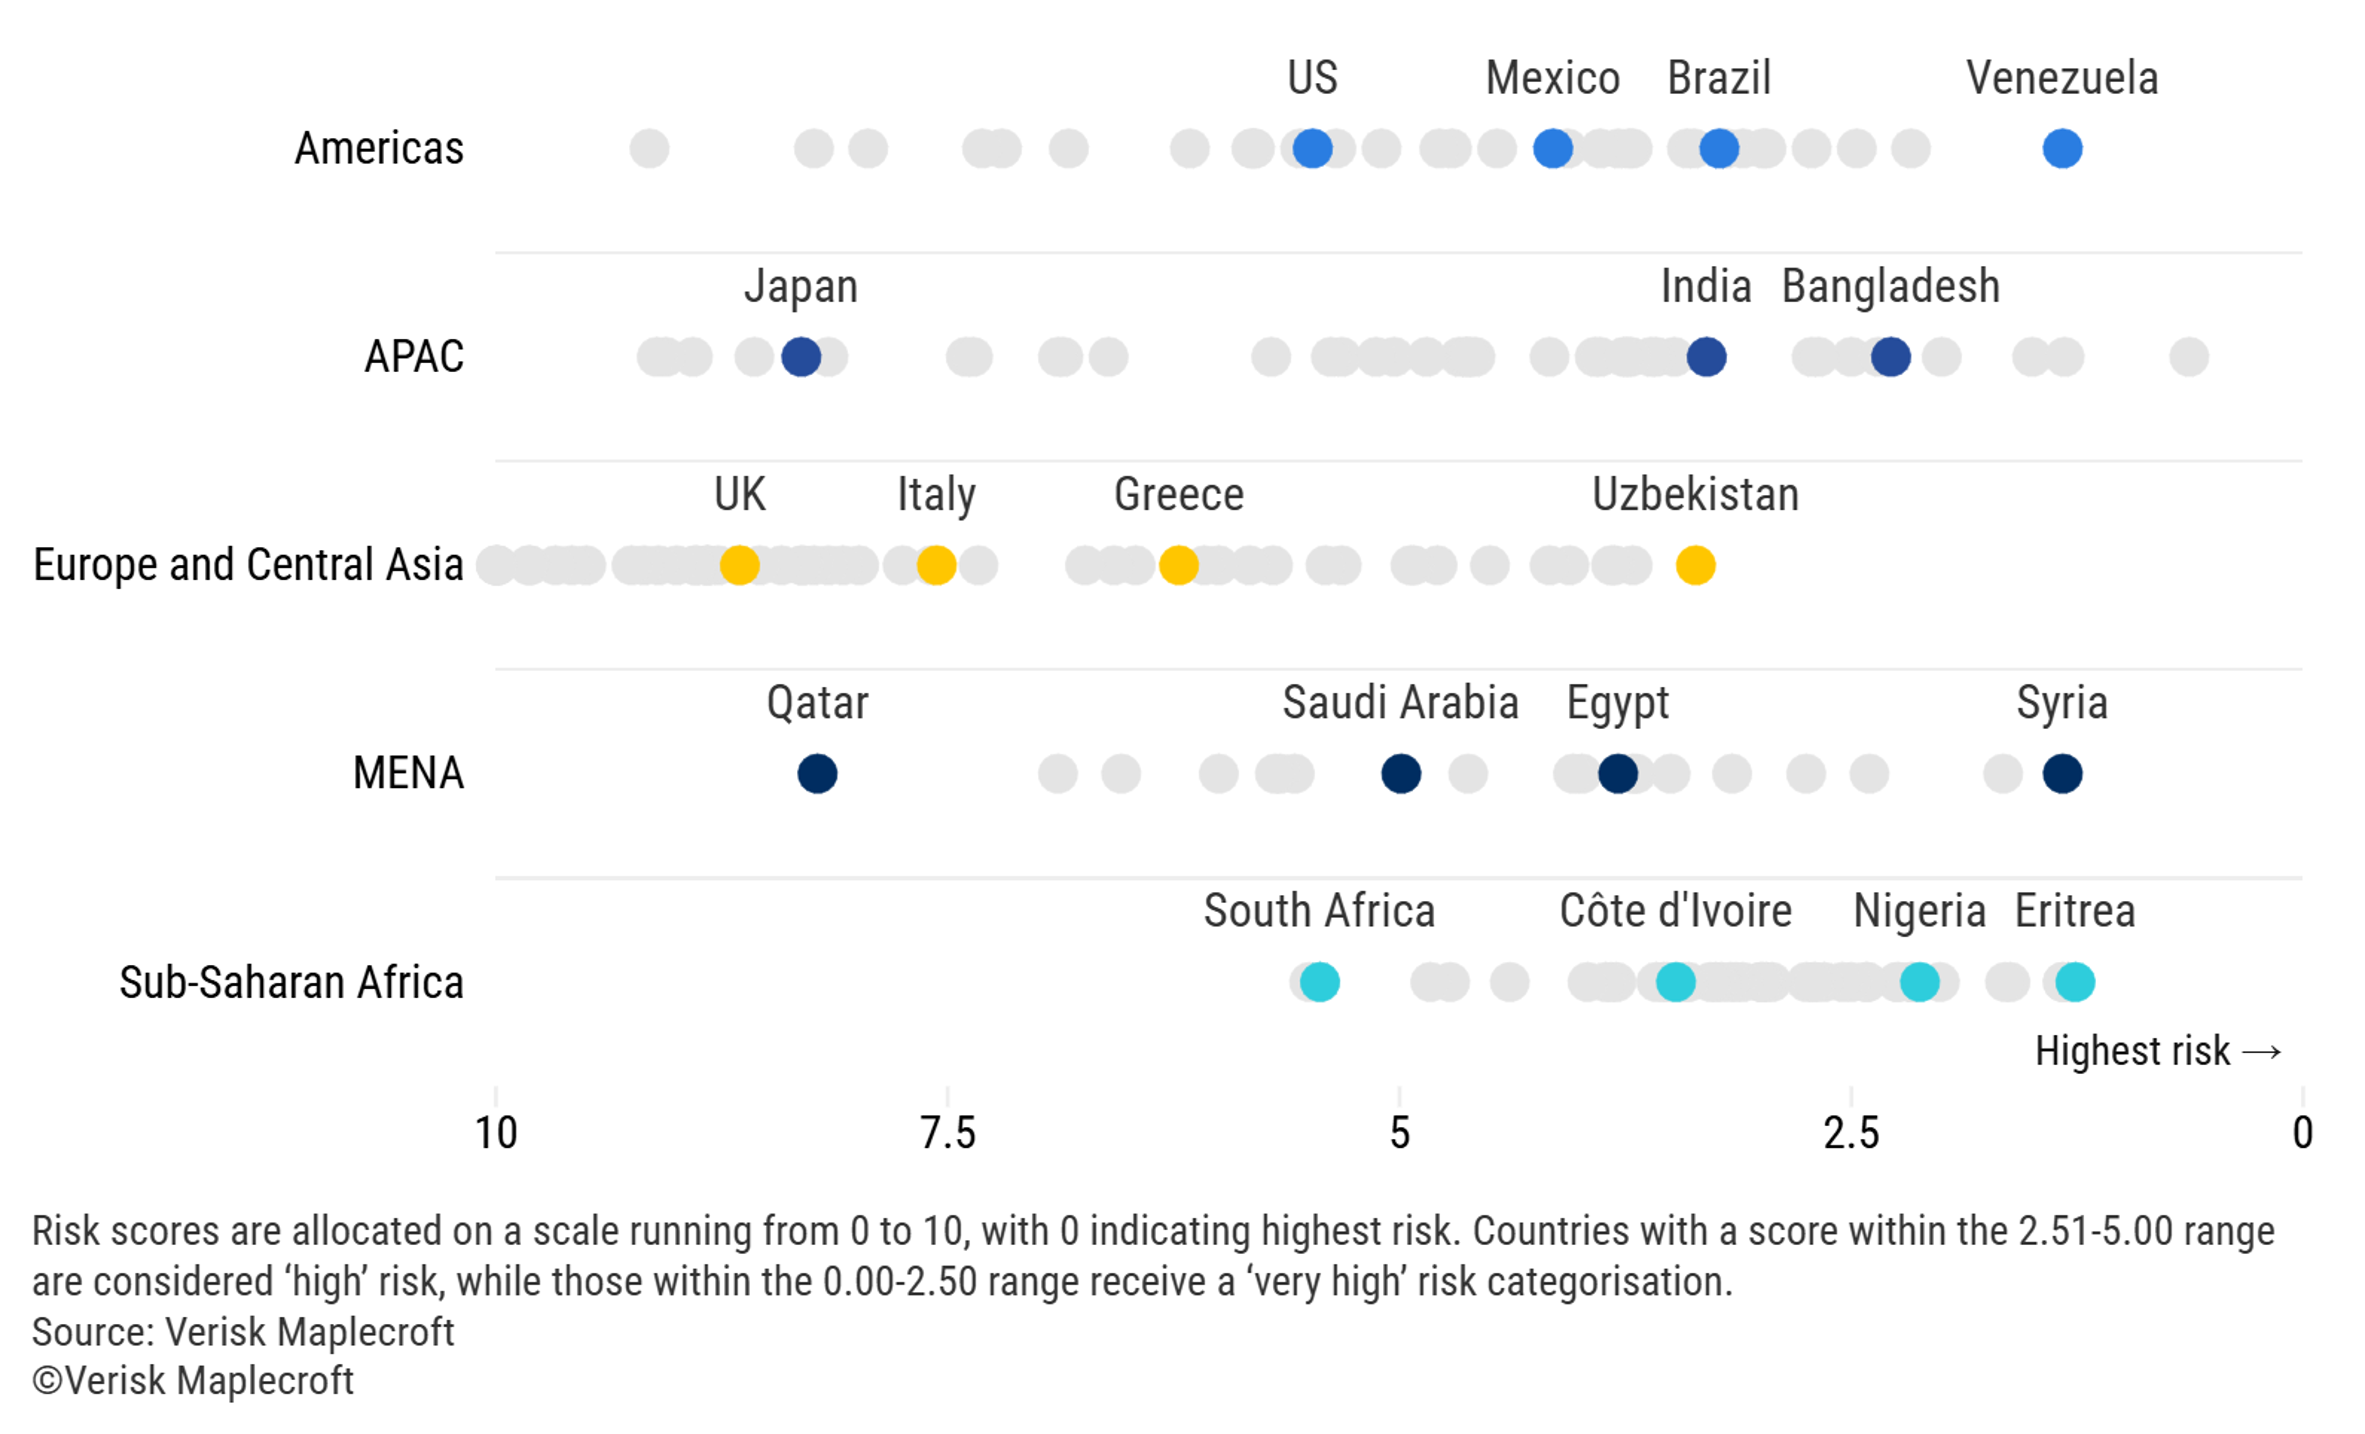
Drawing on our suite of Human Rights Data, our June analysis highlighted uneven progress on reducing child labour risks since 2020. While 49 countries have seen a significant improvement on our Child Labour Index over the past five years, our visual shows that several key supply chain hubs – including India, Brazil and Mexico – remain among the highest-risk jurisdictions globally.
Read our analysis: Child labour remains key supply chain risk amid shifting regulatory landscape
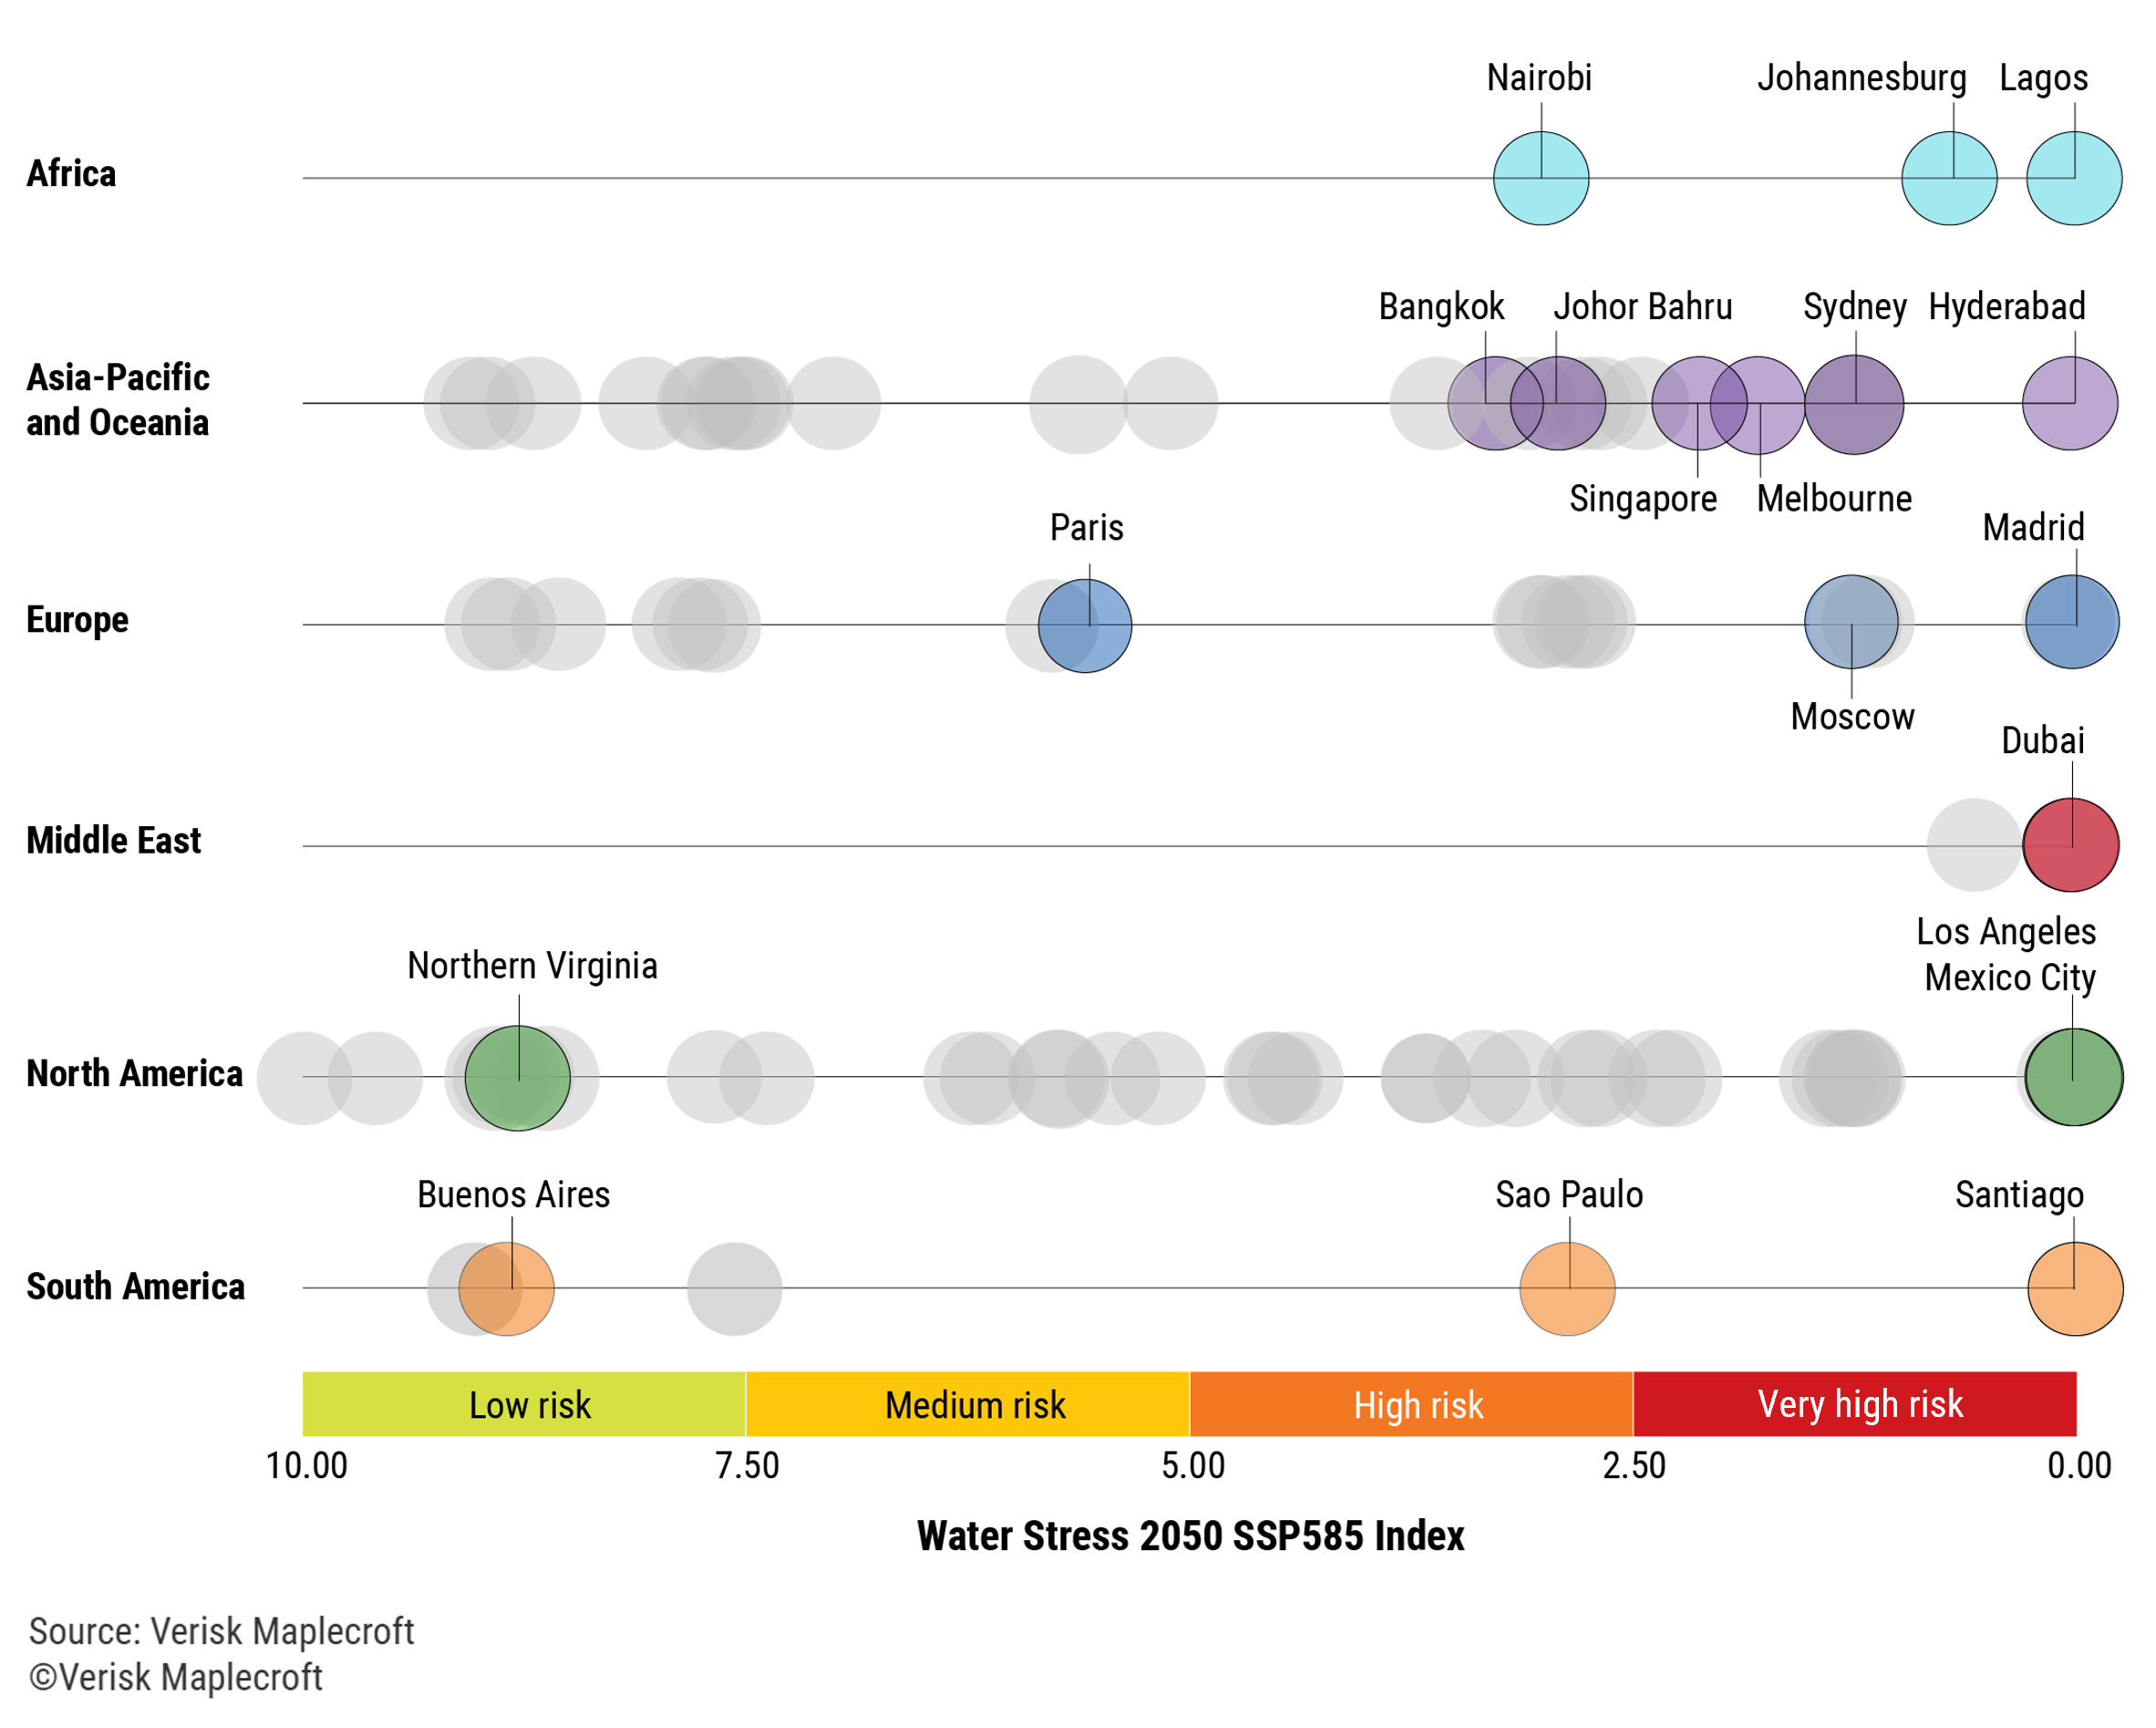
As the AI boom accelerated in 2025, data centres cemented their critical role within the global economy. Our analysis shows that almost 60% of major data centre hub cities are projected to face high or very high risk on our Water Stress Index by mid-century - a trend that could undermine resilience and raise the potential for social and political tensions around water availability.
Read our analysis: Majority of world’s top data centre hubs face array of rising heat-related risks
This visual combines data from our Cost of Labour and Human Capital Availability indices to assess the competitiveness of major sourcing locations. As companies reassess the global footprint of their operations and supply chains in response to rising geopolitical tensions, the data highlights Southeast Asia’s enduring appeal for Western supply chains.
Read our analysis: Southeast Asia most attractive region for human capital and labour costs – India lagging
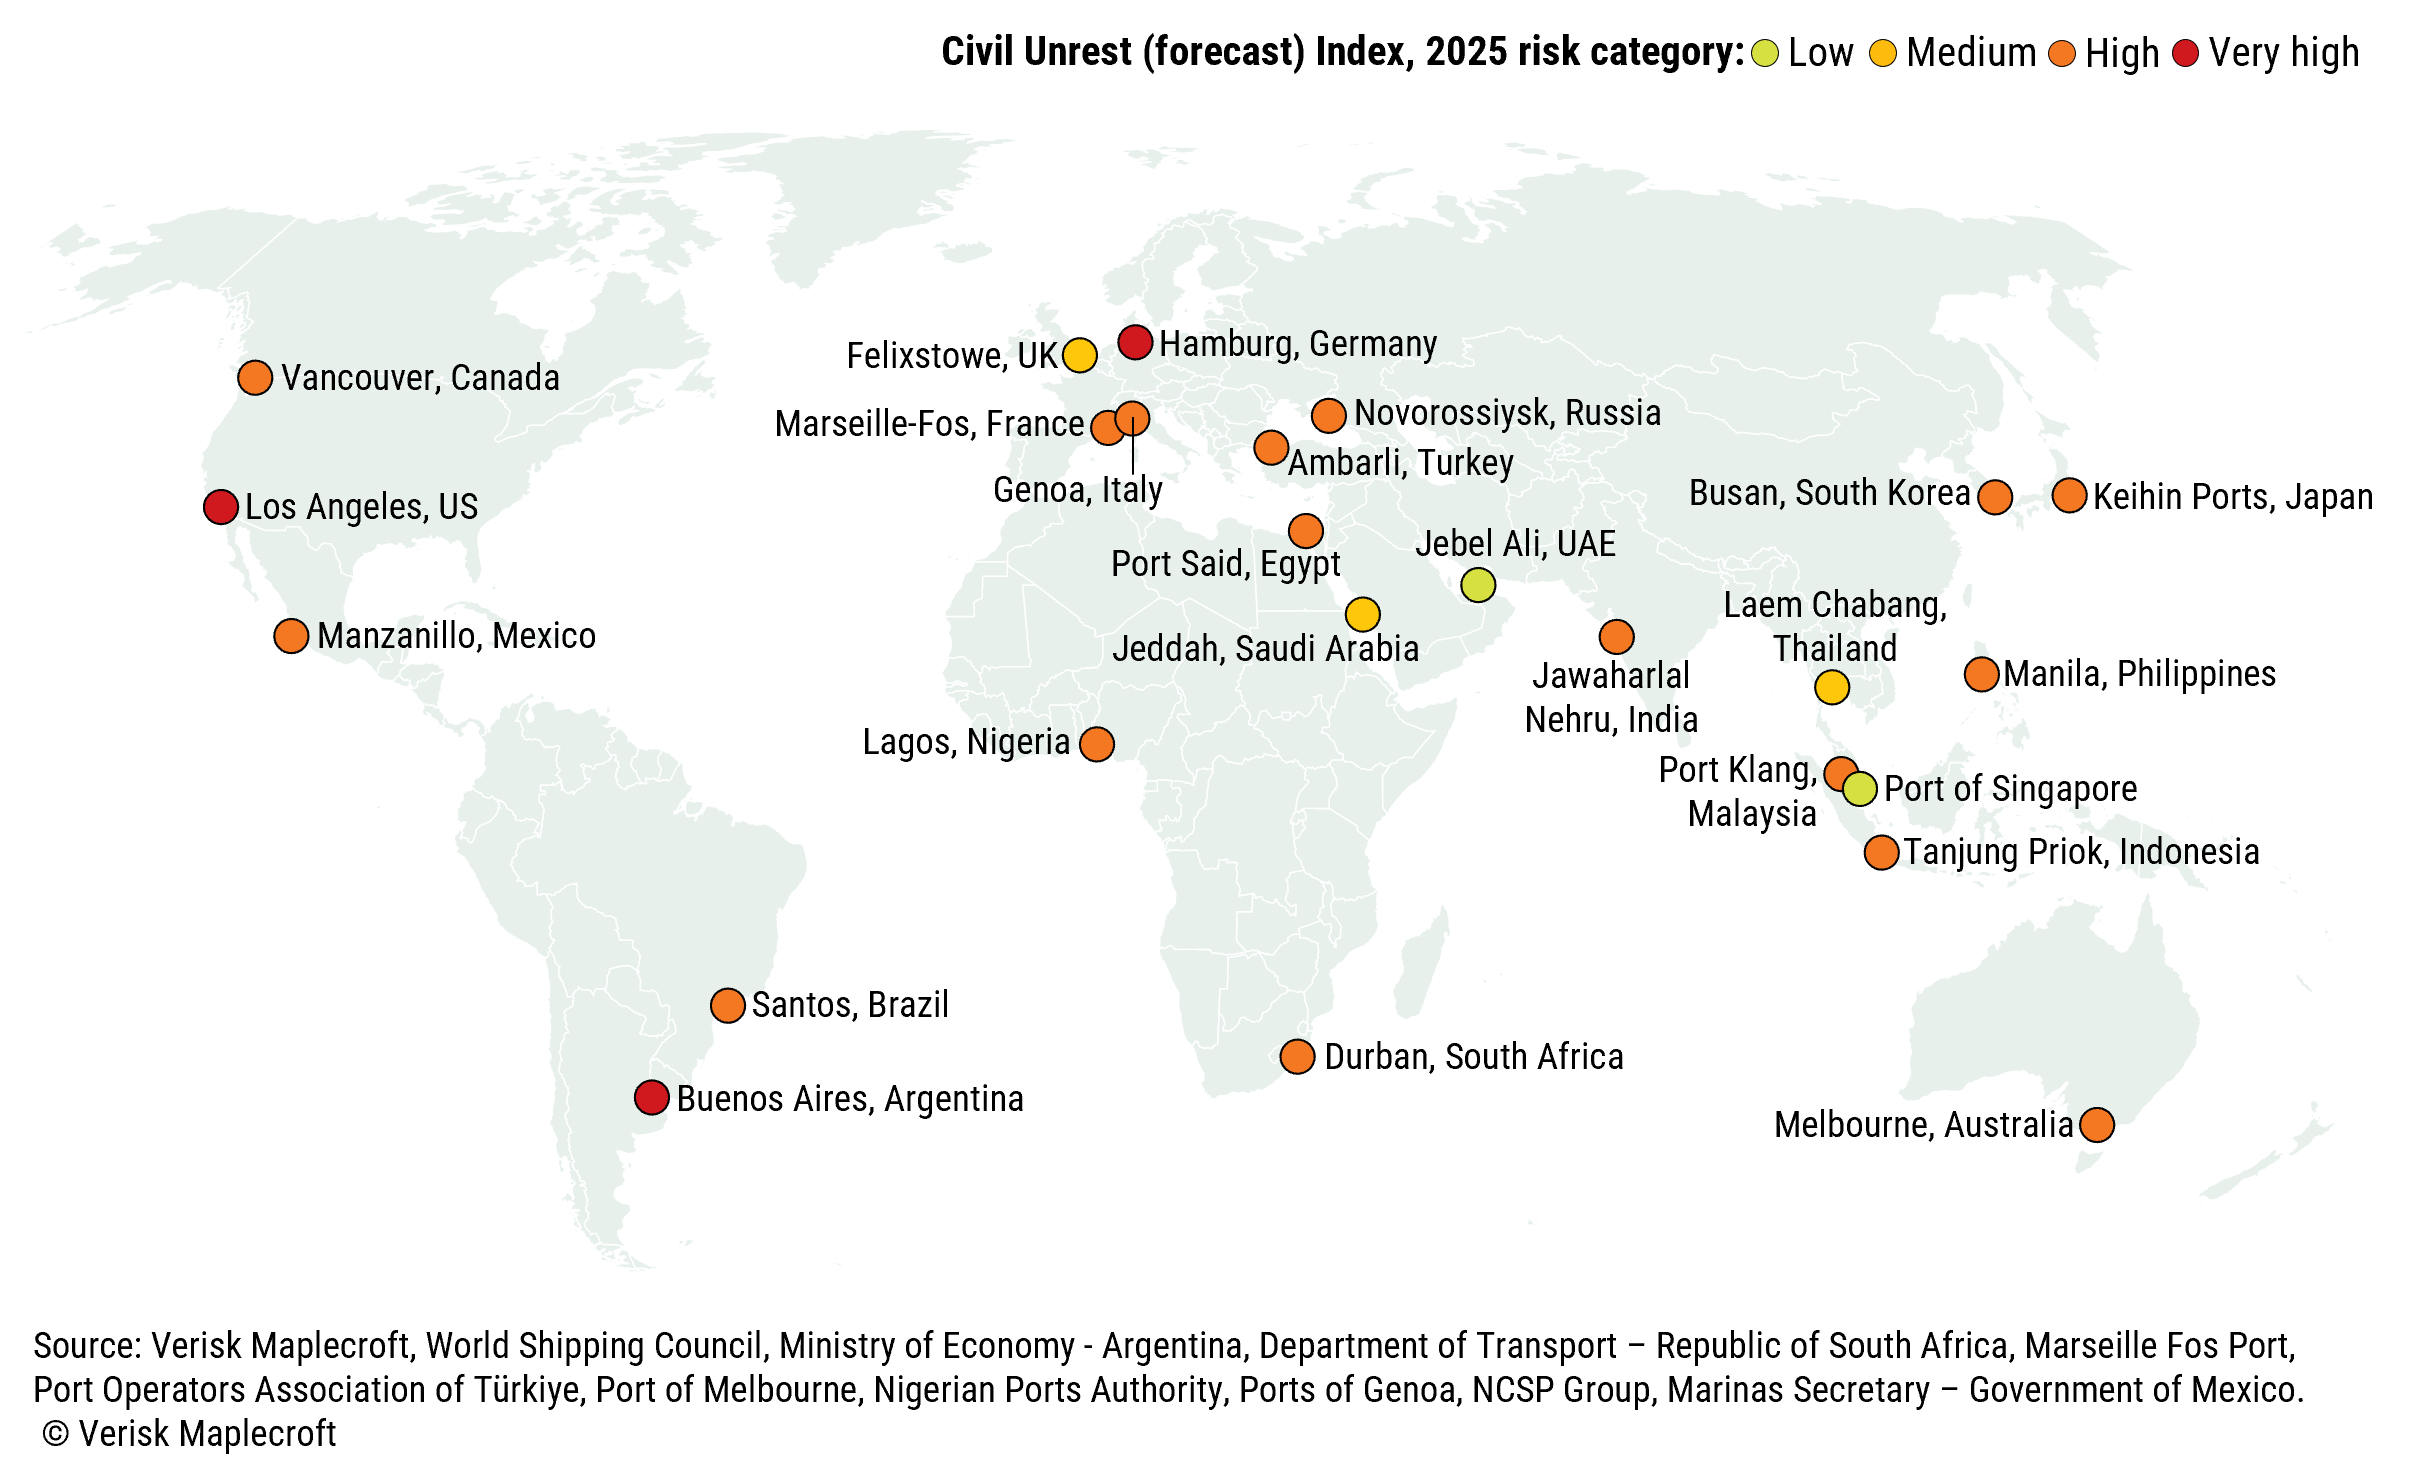
While tariffs and geopolitics dominated headlines in mid-2025, our analysis made clear that businesses should also be wary of the security risks threatening global trade. The map above shows that most major ports are exposed to elevated civil unrest risks, underscoring the potential for disruptive strikes and delays at critical logistics hubs.
Read our analysis: Supply chain logistics facing rising security risks
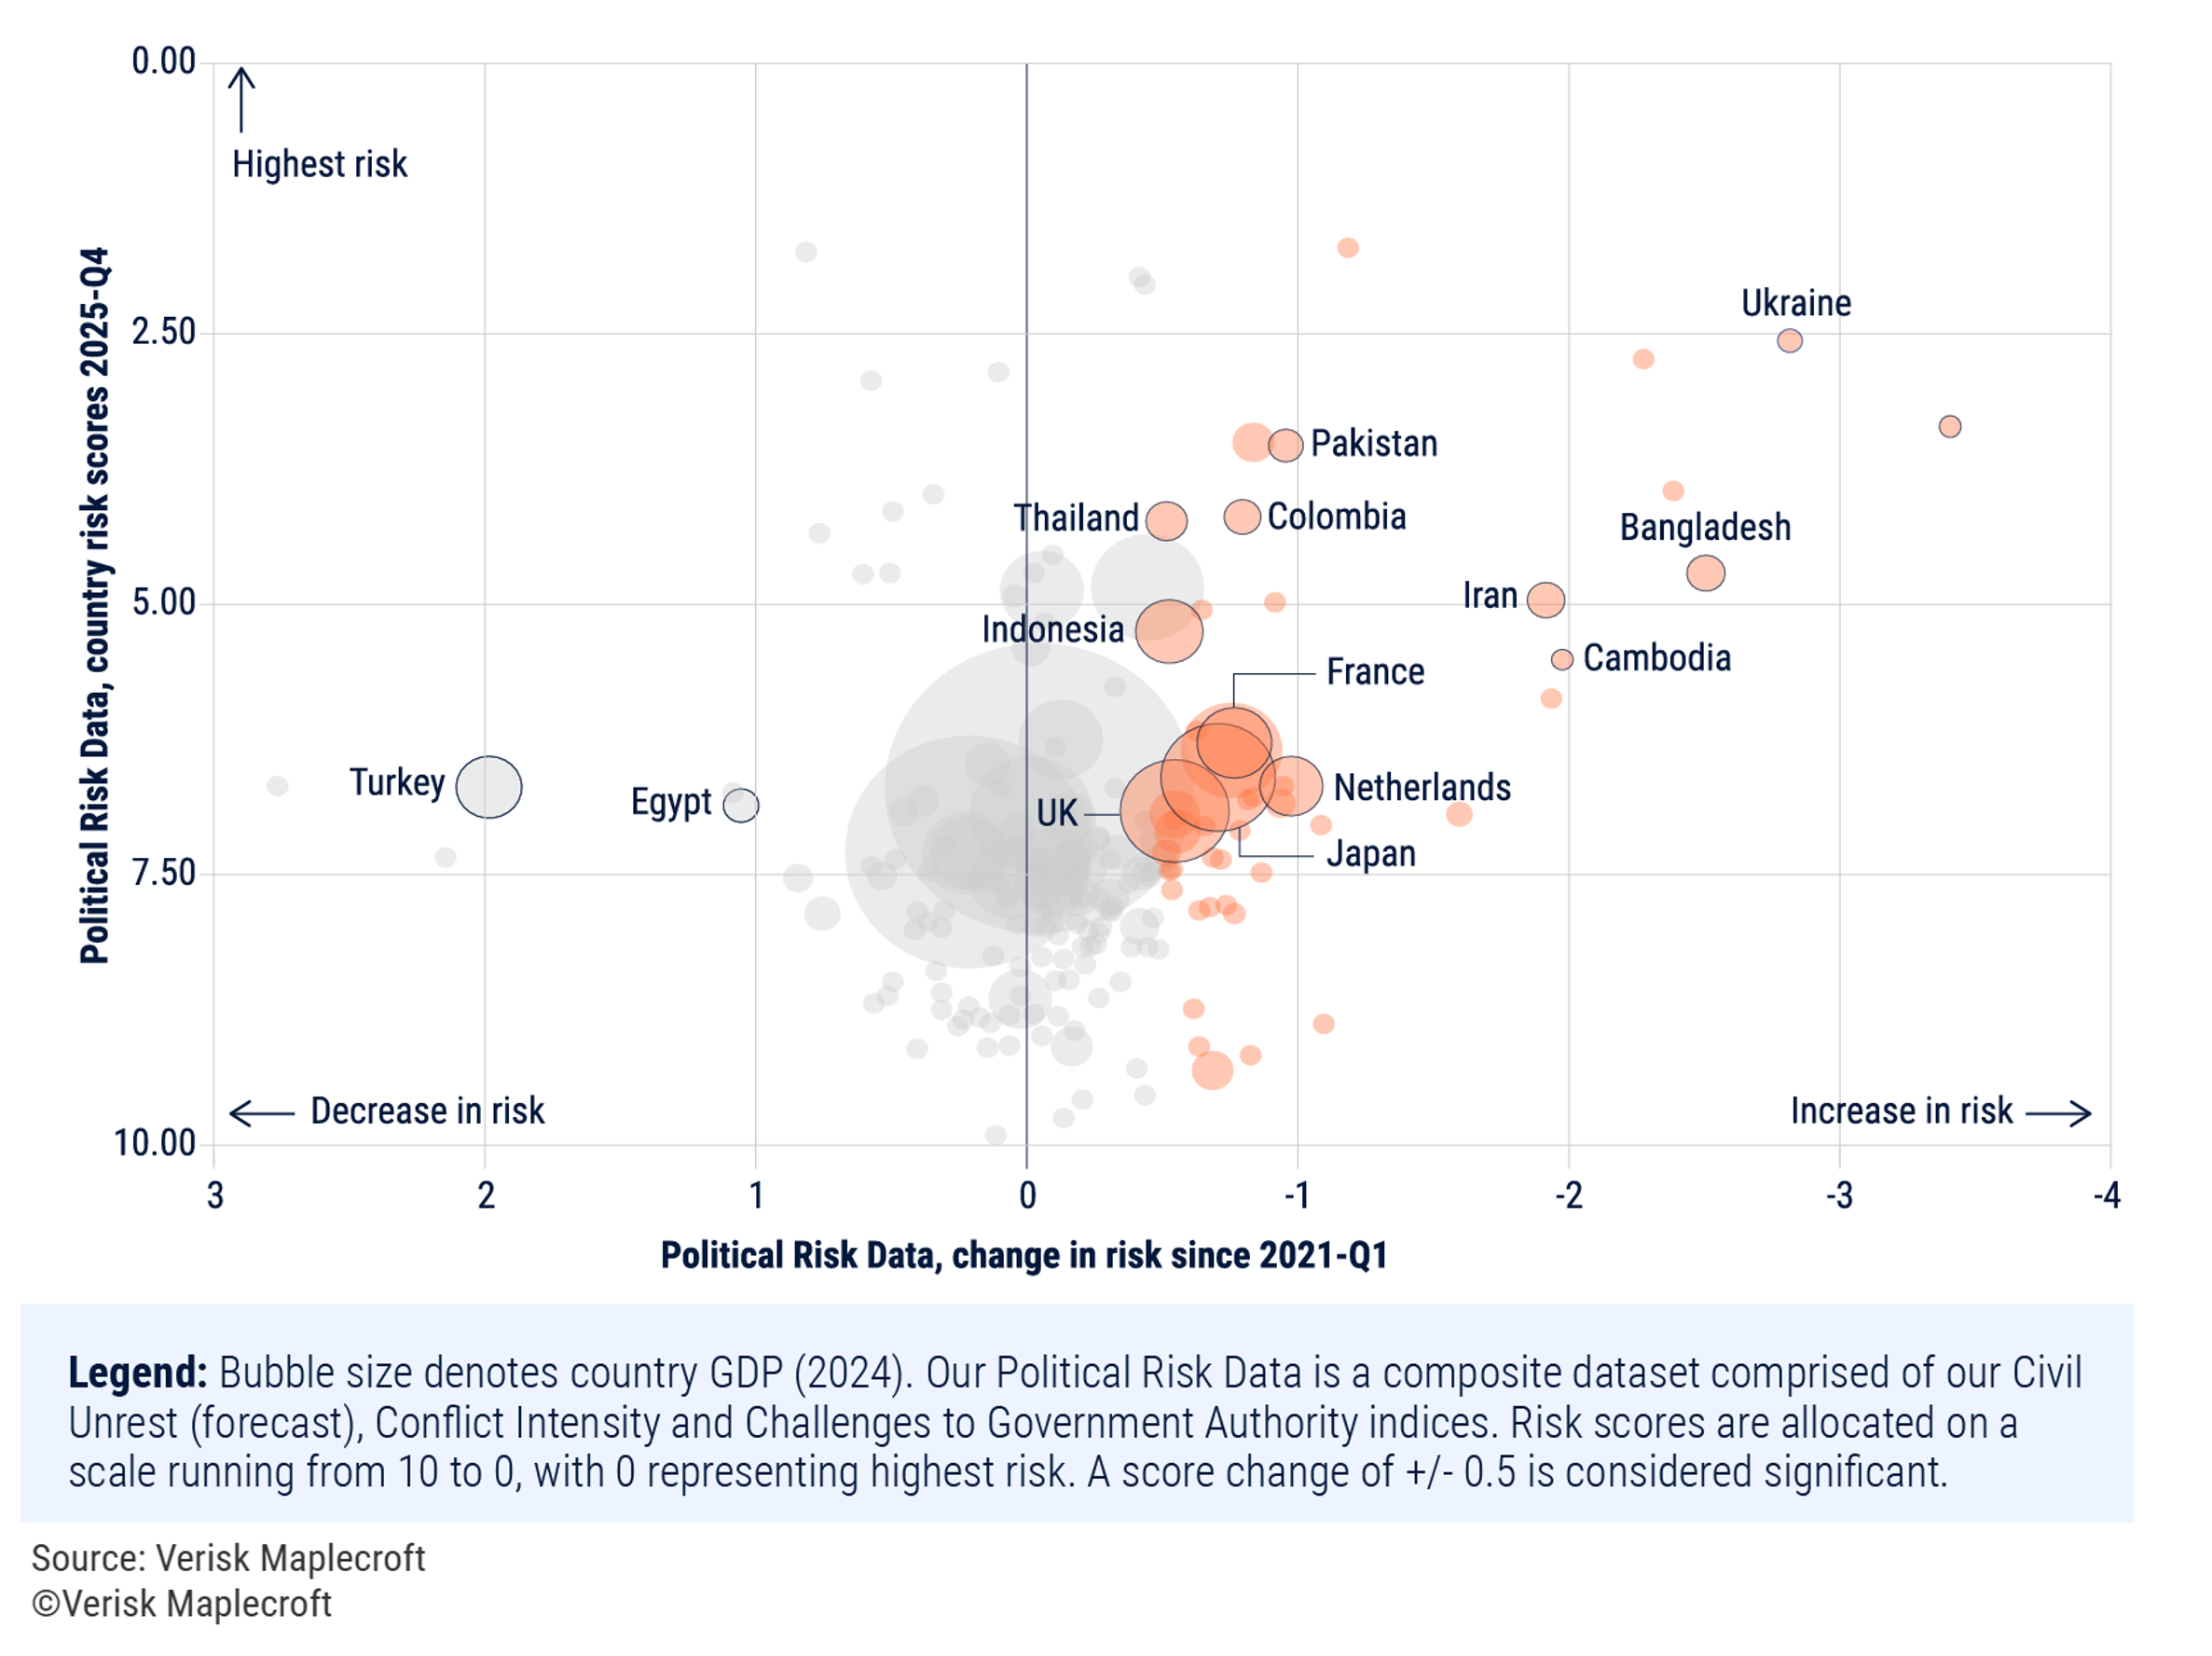
In November we launched our Political Risk Outlook, bringing together our proprietary data and expert insight to explore five key themes shaping the business and market environment. Starting with a data-driven assessment of political risk trends since 2021, we found that 136 countries have seen an uptick in risk in that time – with 50 experiencing a significant increase.
Read our analysis: Political Risk Outlook 2025 - Executive Summary
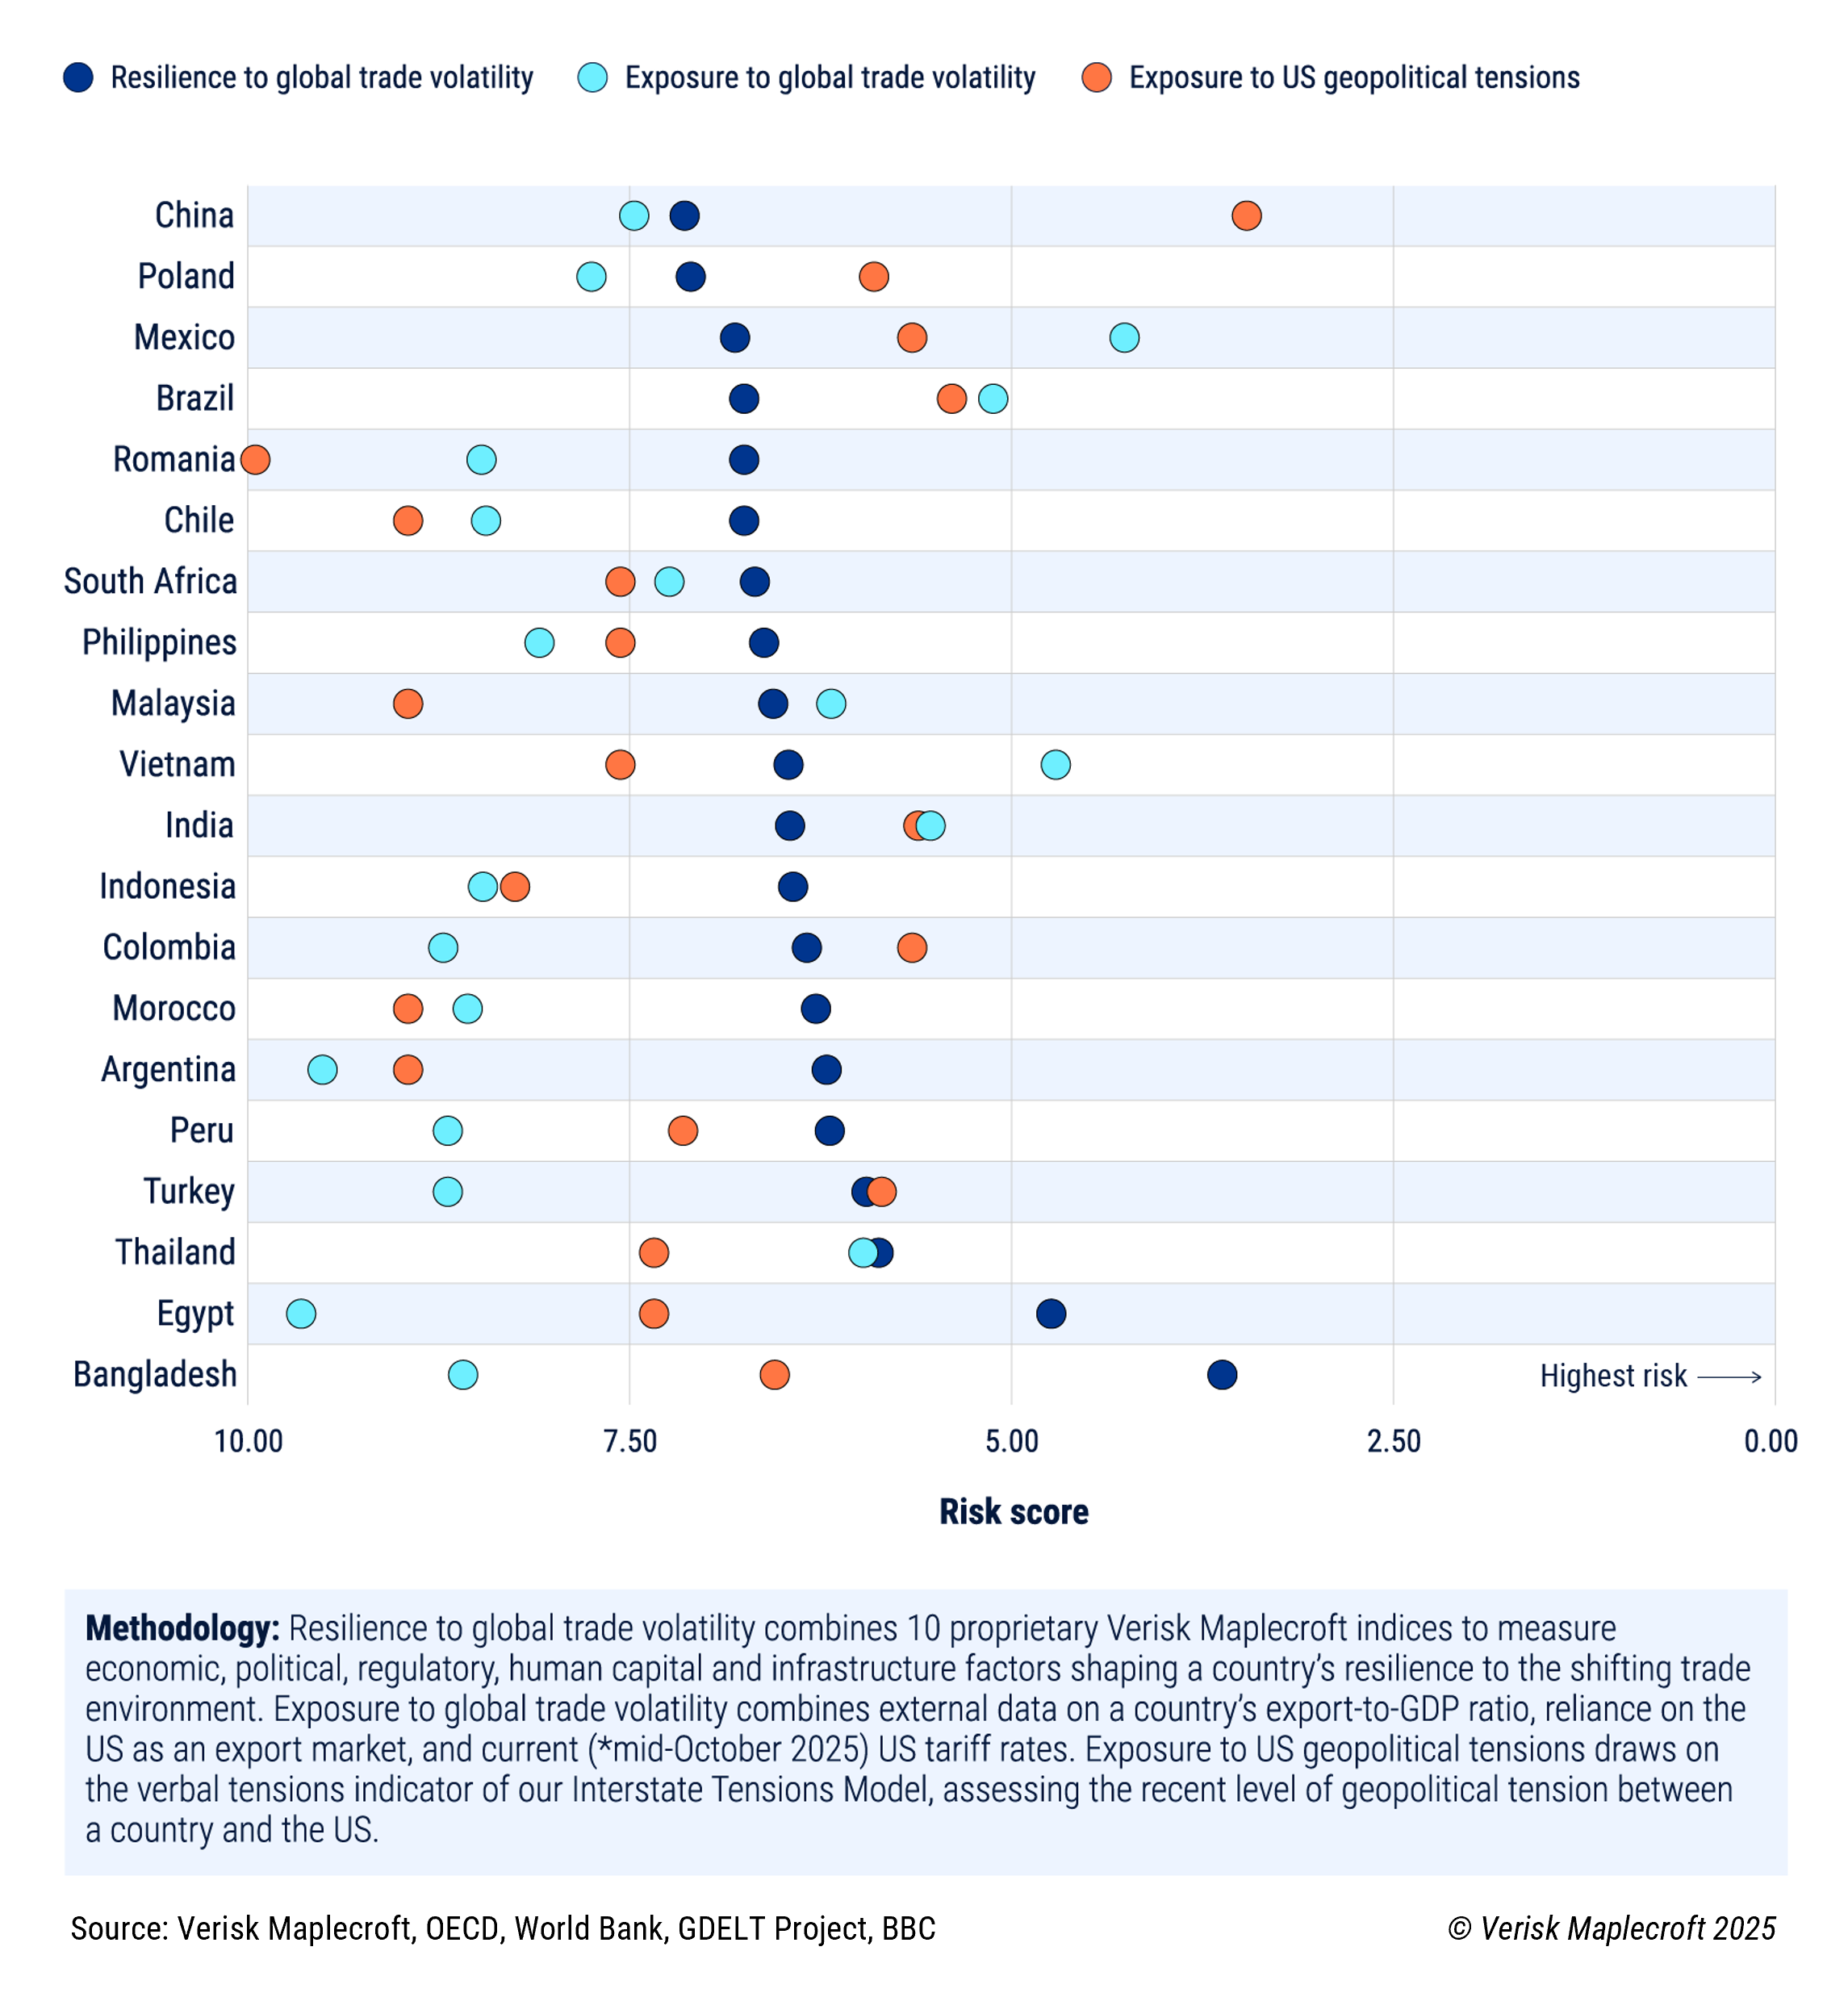
Combining our Country Risk Data with external metrics, analysis from our Political Risk Outlook highlights the resilience of 20 key emerging markets to trade volatility. Our dot plot shows that most major supply chain hubs – including Brazil, China, India and Mexico – are in a strong position to weather the tariff regimes that have buffeted the world throughout 2025.
Read the full insight: Brazil, China, India well placed to weather tariffs, as global trade realigns
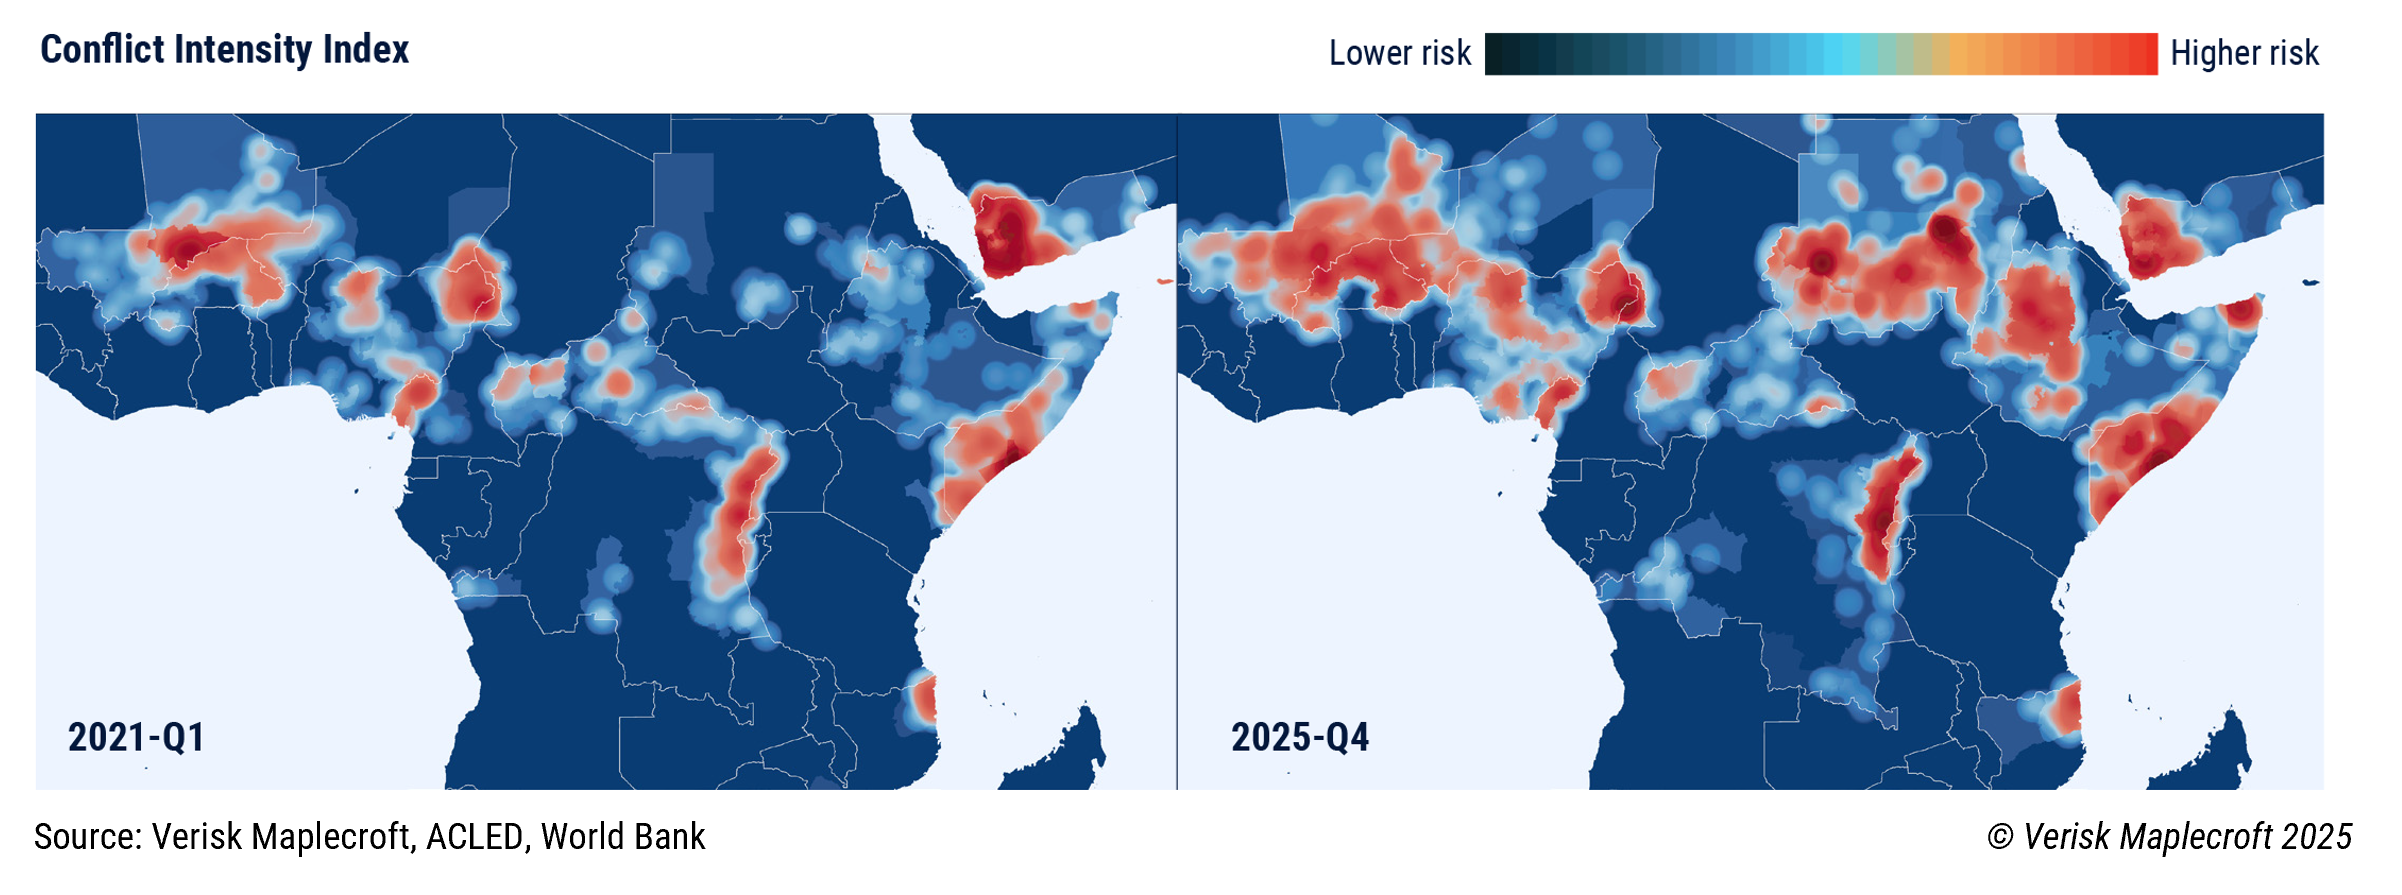
Data from our Conflict Intensity Index shows that areas affected by armed fighting have expanded by 89% since 2021, covering almost 5% of the world’s six permanently inhabited continents. Mapping from our Political Risk Outlook demonstrates that the worst-affected region is sub-Saharan Africa, where a ‘conflict corridor’ of distinct civil wars and insurgencies spanning from Mali in the west to Somalia in the east has more than doubled in size.
Read our analysis: Global conflict zones nearly double since 2021, rising to 6.6 million km²
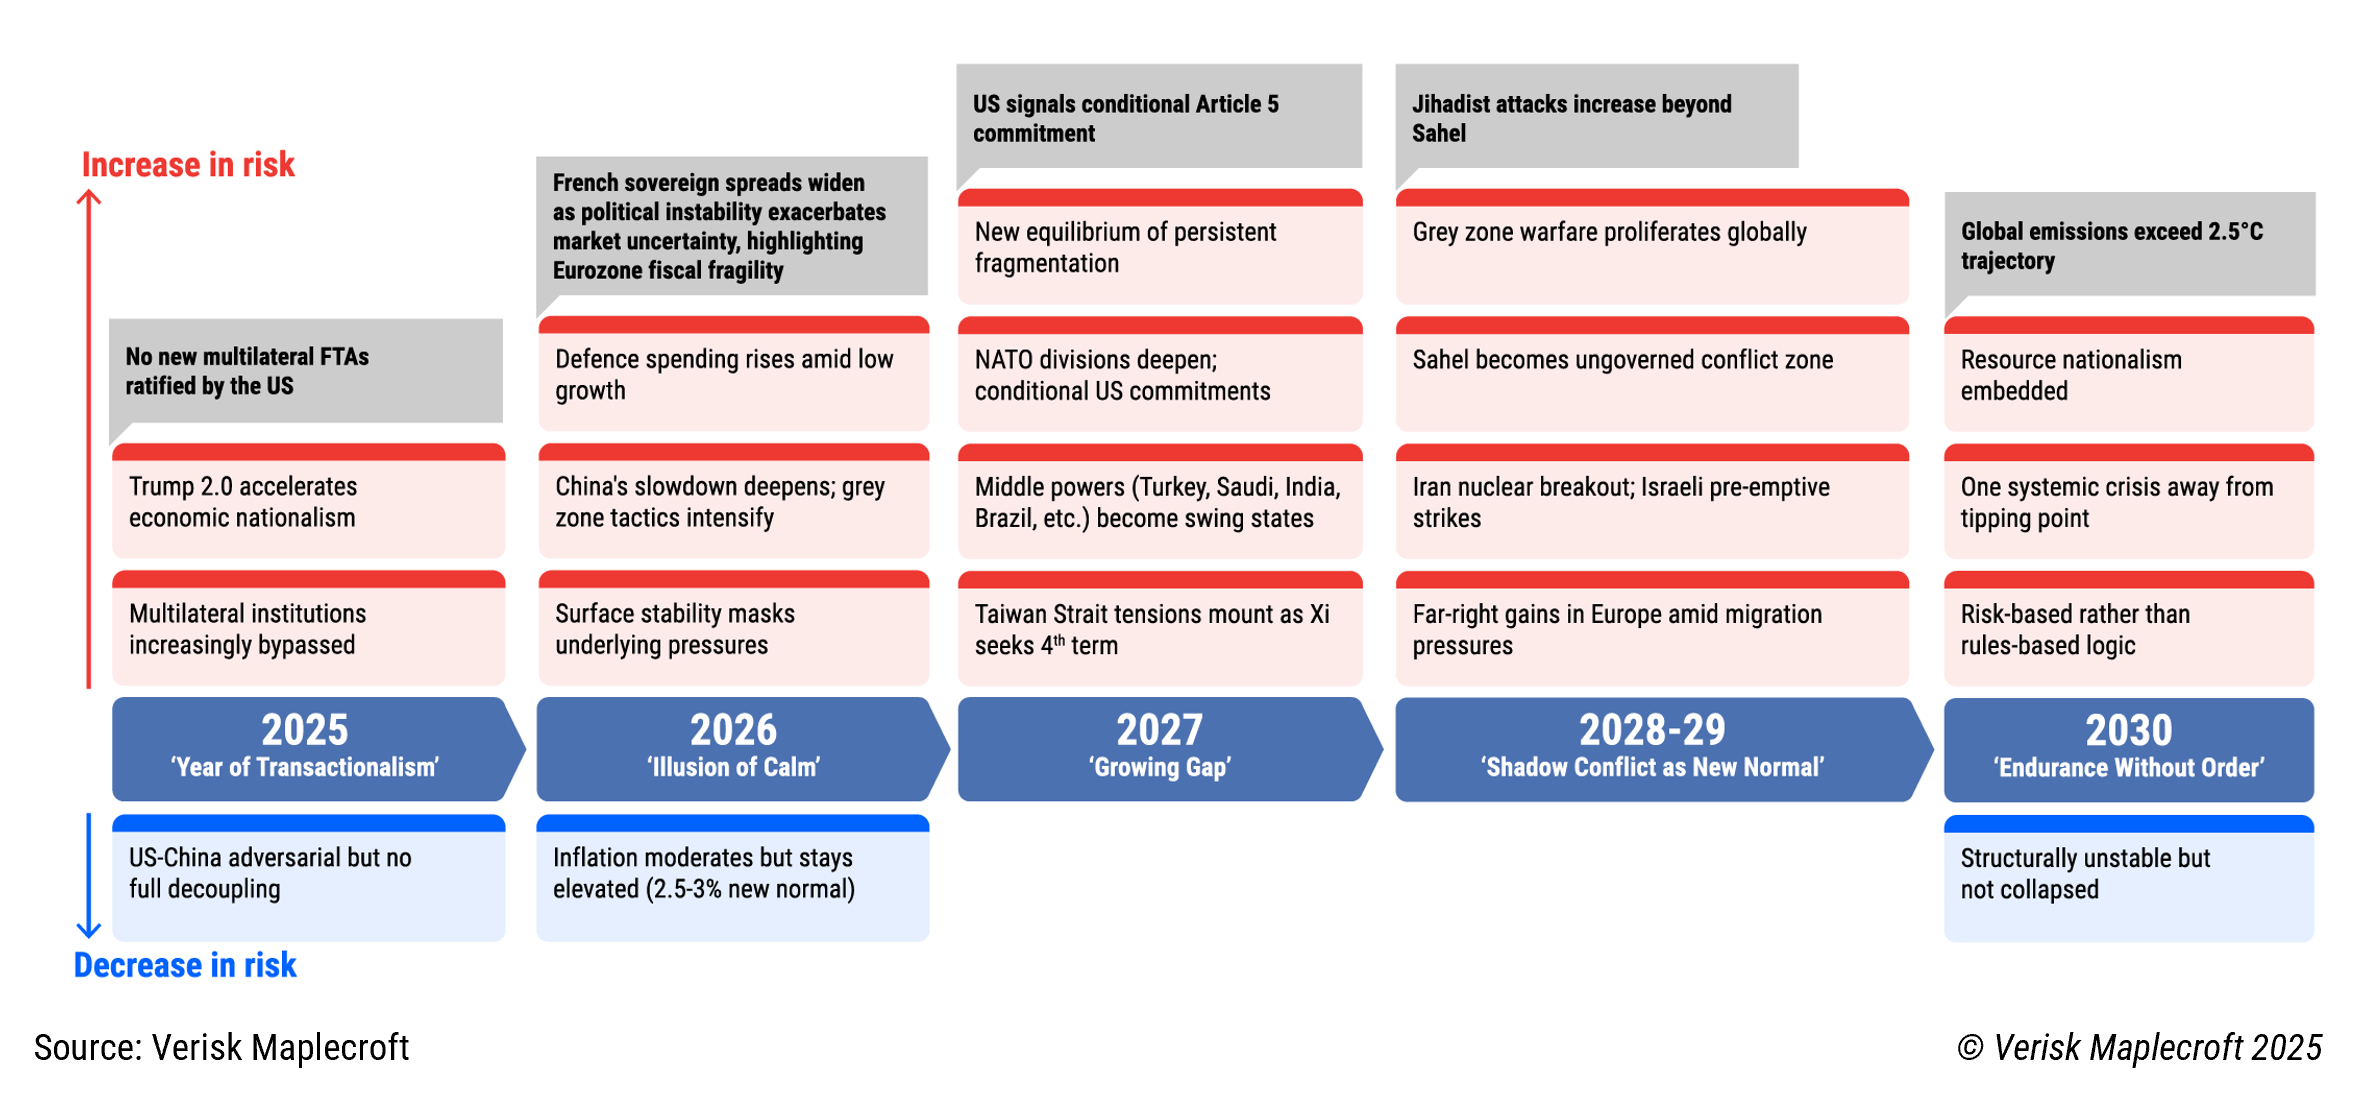
Our analysts closed out the year by charting three pathways for the evolution of geopolitical risk out to 2030. The visual above unpacks signposts from our likeliest scenario, which sees geopolitical competition, shifting alliances, and heightened trade volatility driving persistent uncertainty for business.
Read the full insight: Beyond the storm: How geopolitical risk will reshape global business by 2030