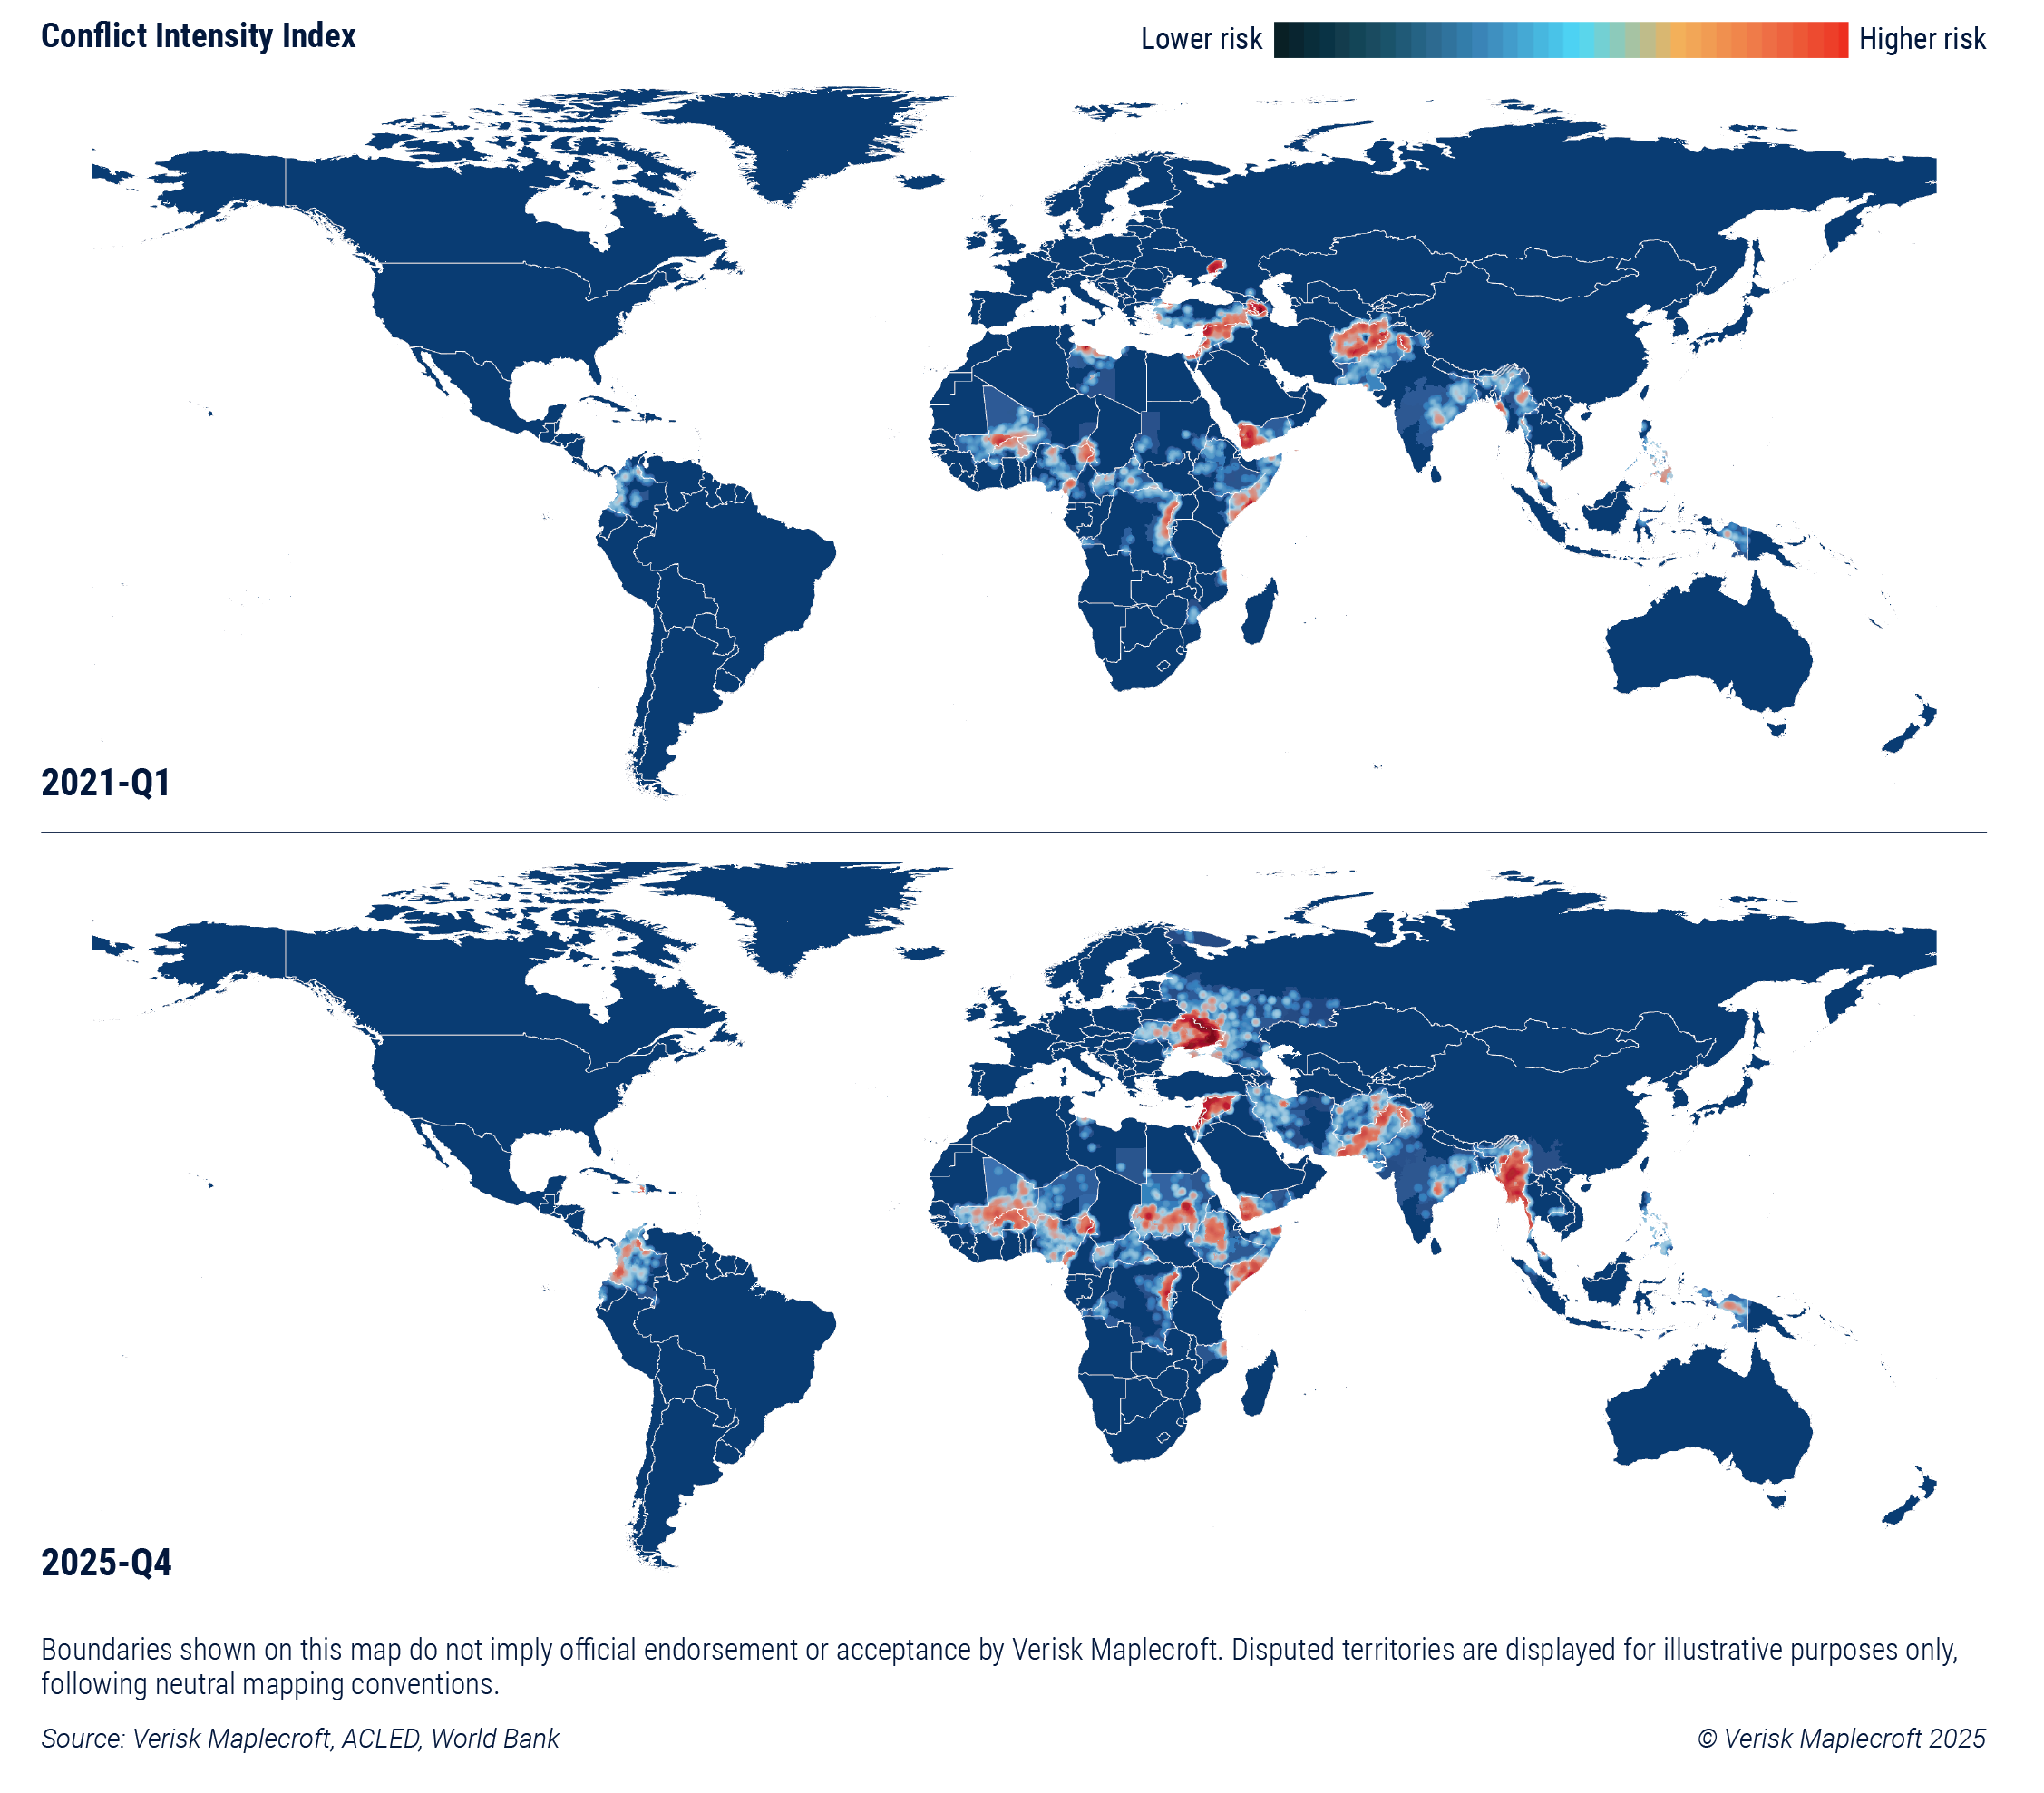
Conflict continues to spread at an alarming rate, affecting populations, governments, business and supply chains across the world. According to the latest data from our Conflict Intensity Index, areas affected by armed fighting have grown by 89% over the last five years to cover 4.9% of the world’s six permanently inhabited continents, up from 2.6% five years ago. More than one and a half times the size of the European Union, 6.6 million km2 is now affected by civil conflict or fighting between states.
Most of the increase is driven by well-known conflicts, including the Russia-Ukraine war, civil wars in Sudan, Ethiopia and Myanmar, jihadist insurgencies in the Sahel, and regional fighting in the Middle East triggered by the Hamas terrorist attack against Israel in October 2023 (see Figure 1). However, some are flying more under the radar, such as the spread of armed fighting in Nigeria, Pakistan and Colombia, with the latter clocking up the fourth largest expansion of conflict areas in the world over the past 12 months, due to widening clashes between insurgents, criminal gangs and government forces.
The spread of conflict globally is both a cause and a symptom of a more geopolitically fractious world. For governments, its impact is multi-faceted, extending from increased defence spending, to expanded sanction, tariff and export-control regimes, through to accelerated national resilience ambitions in areas such as critical minerals, components and tech. Businesses are also having to navigate the fallout from this shifting risk landscape, from the direct threat expanding armed conflict poses to company staff, assets and operations through to more indirect consequences, such as the elevated risk of disruption to their supply chains, consumer boycotts, or state-backed cyber and sabotage attacks against their assets.
A key question is whether this trend will continue. Our data shows heightened tensions between countries on Europe’s eastern flank and Russia due to the war in Ukraine. The potential for inadvertent military escalation amid Moscow’s ‘grey zone’ activities aimed at NATO members will prove an important swing factor over the coming months.
All global regions are experiencing intense conflicts
The Conflict Intensity Index measures the severity of armed conflict occurring within a country’s borders by looking at several factors including fatalities, the weapons used, the extent to which civilians are targeted, the recency of the fighting, and the proportion of the territory affected. It’s that last indicator that has seen the greatest deterioration globally since the beginning of 2021, which is in turn driving an overall worsening of the world’s performance on the broader index.
In terms of the severity of conflict, the Occupied Palestinian Territory (OPT) is the world’s worst performing country by some margin in 2025-Q4, even if the first phase of the October 2025 US-brokered peace plan provides grounds for cautious optimism. Beyond the OPT, the 10 highest risk countries globally are Lebanon, Syria, Ukraine, Myanmar, Israel, Burkina Faso, Sudan, Somalia and Haiti.
On a regional level, sub-Saharan Africa has seen by far the biggest growth in conflict zones over the past five years, as a ‘conflict corridor’ of distinct civil wars and insurgencies spanning from Mali in the west to Somalia in the east has more than doubled in size (see Figure 2). A key driver of this regional trend is the ongoing civil war in Sudan, with the north-east African state chalking up the greatest increase in territory impacted by fighting globally since 2021, which now sees a full third of the country blighted by war.
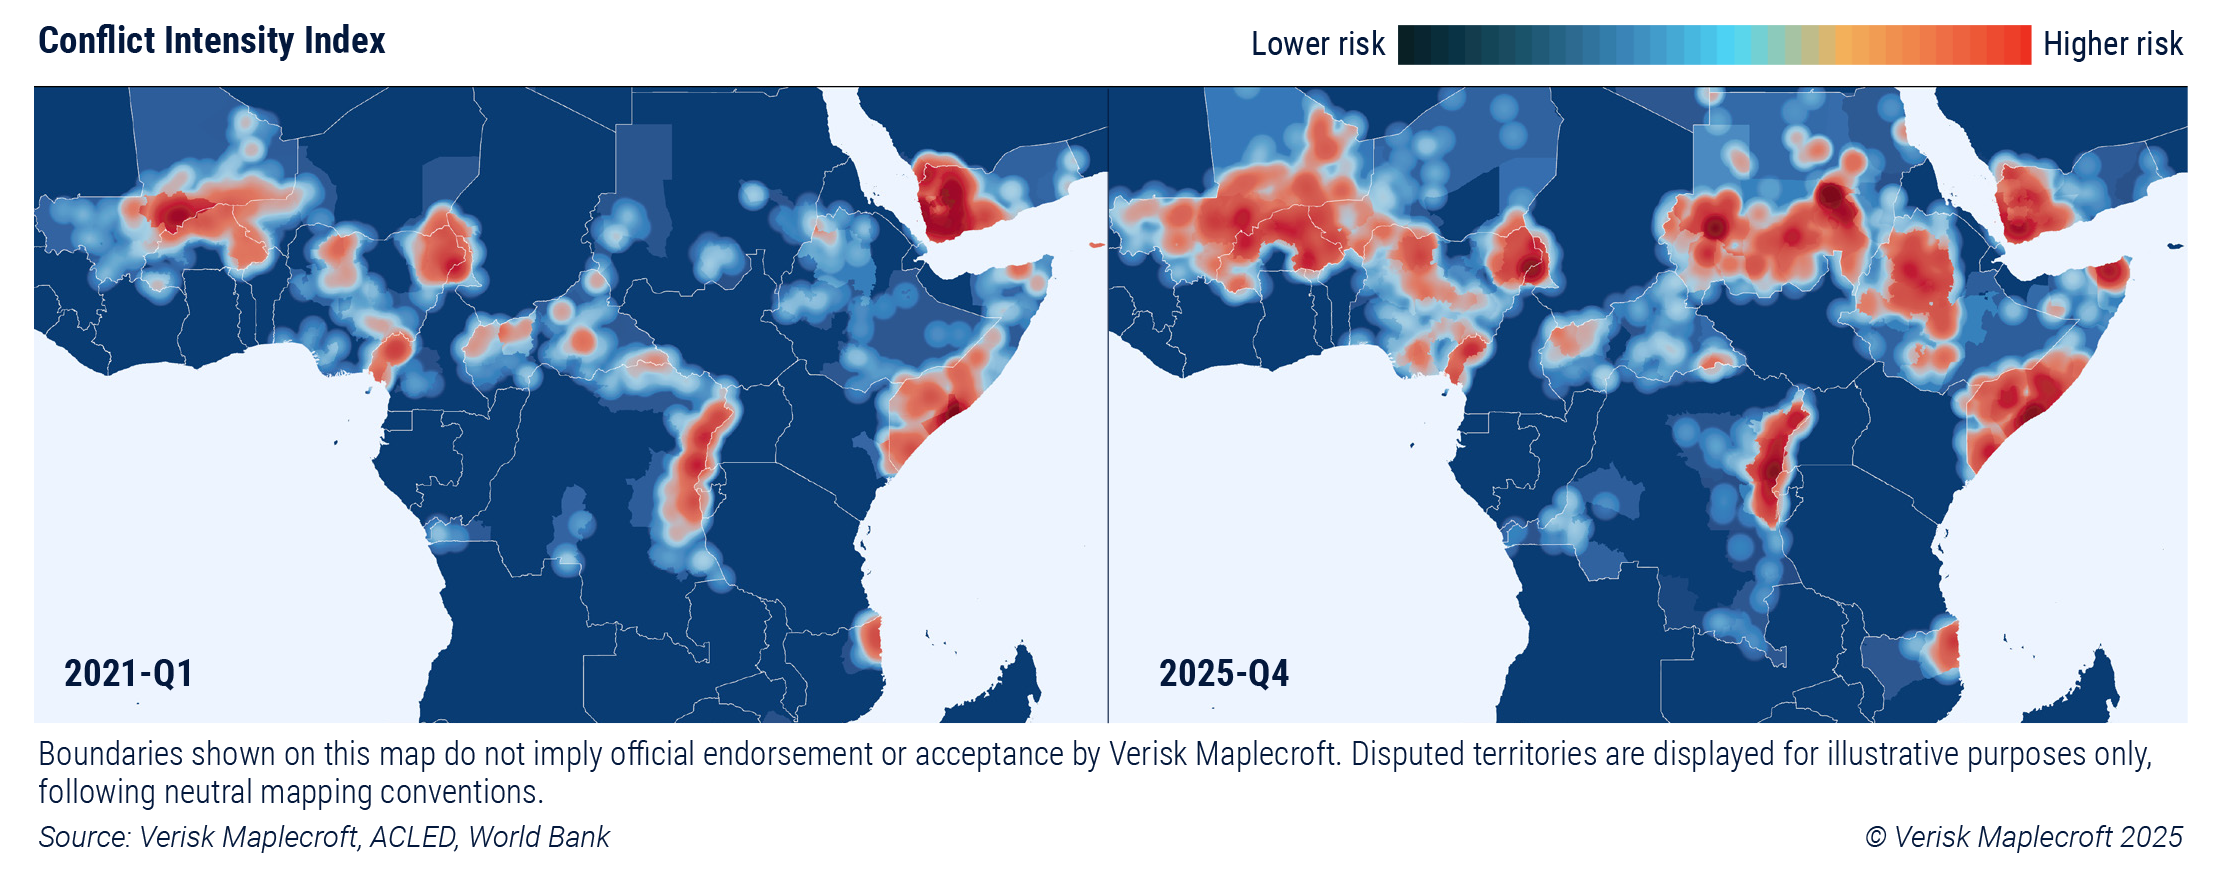
While the overall global trend is one of spreading conflict, it’s not all one-way traffic. There are some states where peace remains elusive, but that have nevertheless seen a significant reduction in the proportion of territory affected by fighting over the past half decade; most notably, Afghanistan, the Philippines, and Libya.
Business assets see 22% jump in exposure to conflict
Understanding complex global conflict dynamics in today’s geopolitically fractured world is crucial for multinational companies, investors, and insurance firms. Our Asset Risk Exposure Analytics (AREA) data measures the exposure of over 4 million assets of publicly listed companies to political, human rights, climate and environmental risks, including conflict.
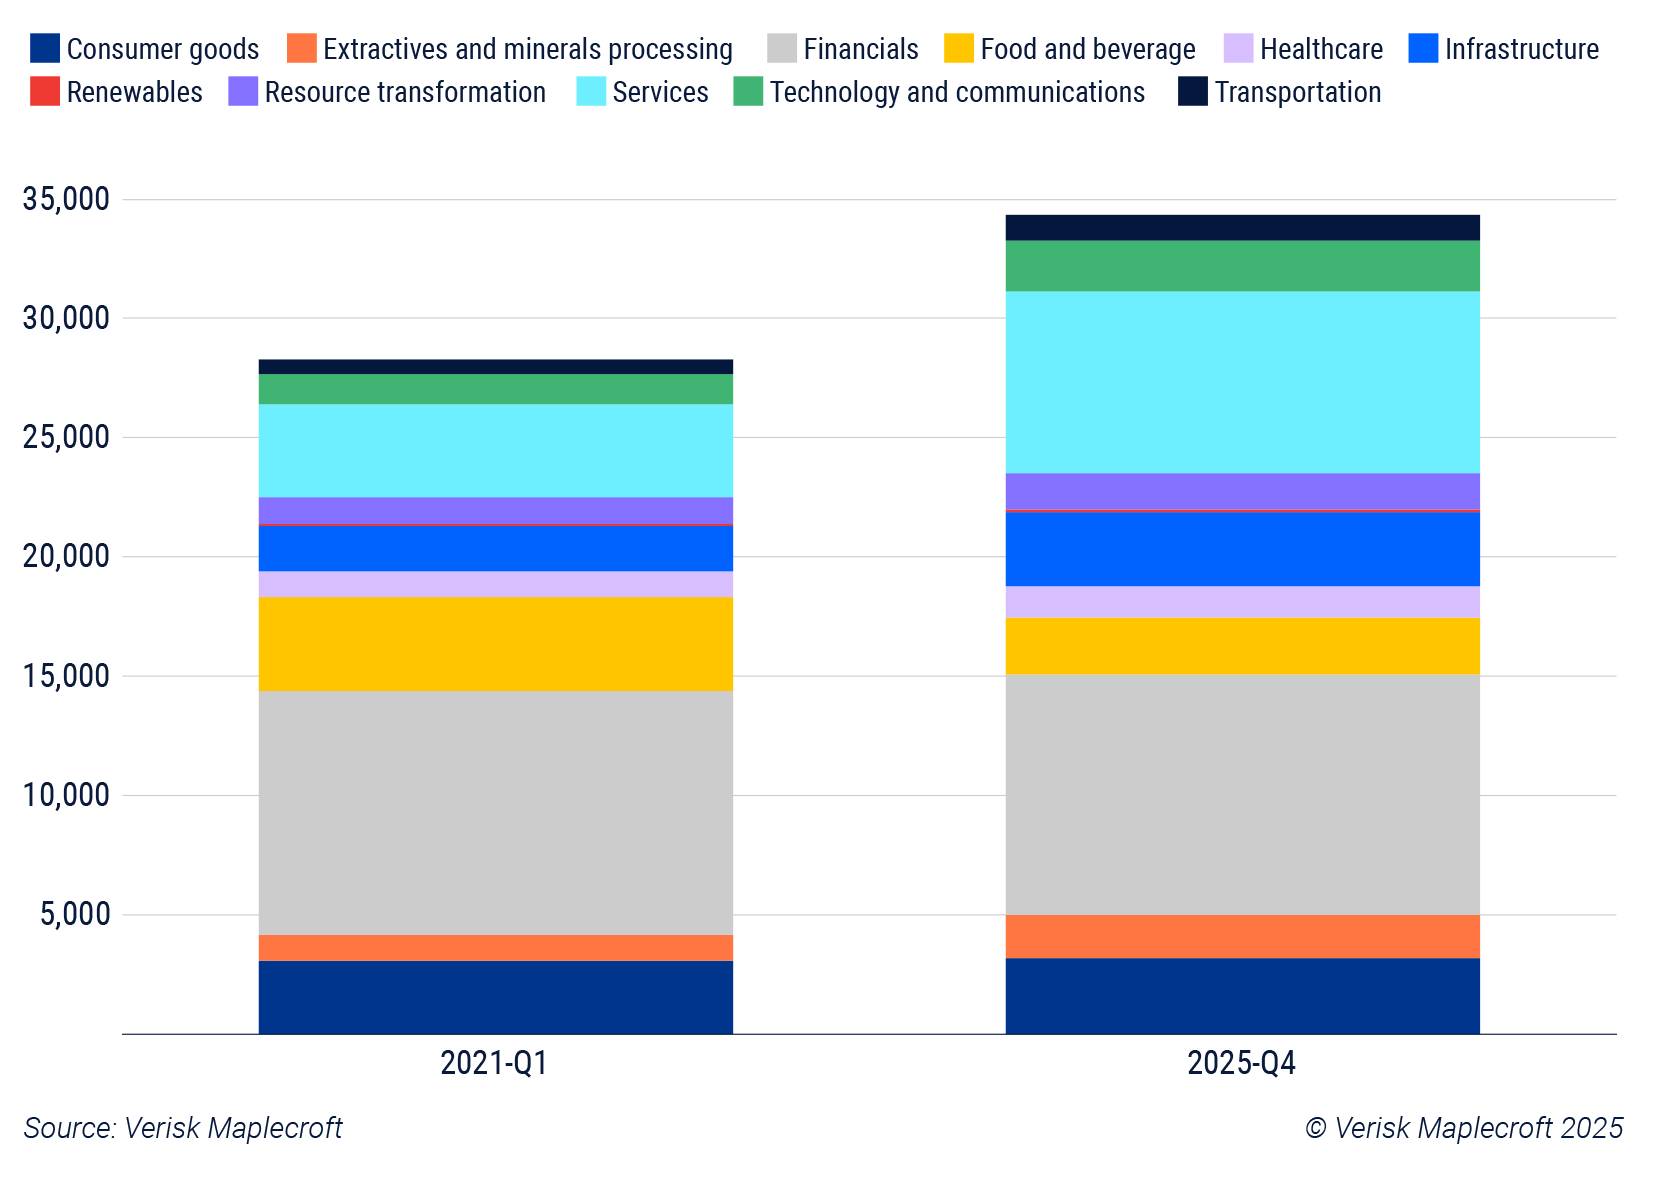
The overall exposure of corporate assets to conflict remains low, amounting to less than 1% of the assets of publicly listed firms. That said, the data shows that 36,045 assets are now located in conflict zones, up from 29,515 in 2021-Q1 – a 22% uplift in five years (see Figure 3). This uptick in exposure to conflict is starker when you zoom in on certain sectors. For example, the extractive & mineral processing, technology & communications, and infrastructure sectors have all seen the number of assets located in conflict-affected areas increase by over 60% since 2021.
Beyond this trend of rising physical security risks linked to armed fighting, there are a myriad of indirect consequences that business leaders need to grapple with. Wars can disrupt global supply chains, lead to markets becoming inaccessible, elevate expropriation risks or trigger consumer boycotts targeted at corporate entities. The rise of grey zone warfare is also seeing companies themselves become targets of hostile states, for example via cyber-attacks, sabotage or disinformation campaigns, for the perceived transgressions of their host governments.
Where next?
Our Interstate Tensions Model assesses the potential for countries to engage in a bilateral dispute over the next 12 months that results in the threat, display or use of force, which could – in a worstcase scenario – escalate to the point of inter-state war. China-Taiwan, North Korea-South Korea, and the United States-Iran are among the highest risk pairings in the model in 2025-Q4 and require close monitoring. The same goes for neighbours that have seen among the greatest increase in interstate tensions over recent years, most notably DR Congo-Rwanda.
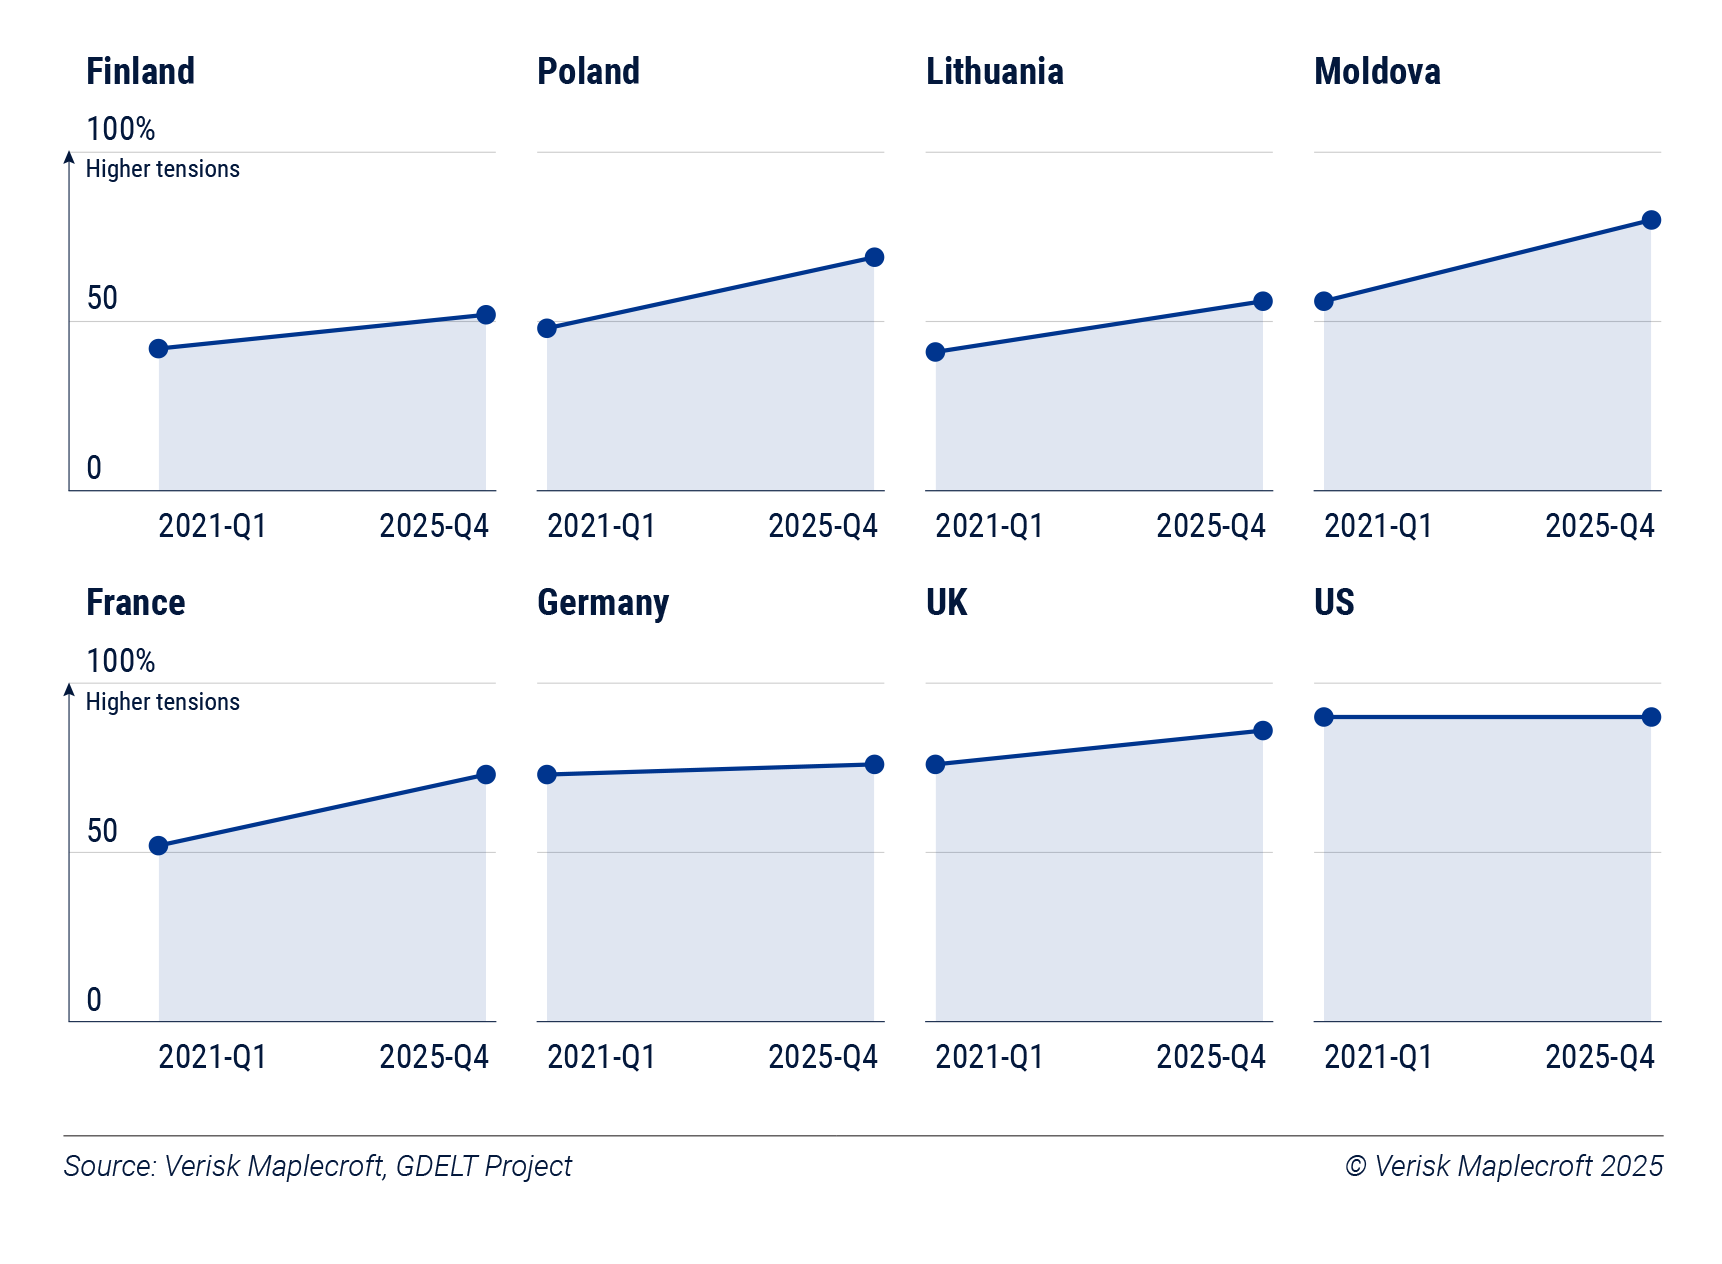
A key focus for those in, or exposed to, Europe is how tensions between Russia and NATO states will develop. Our Interstate Tensions Model shows tensions between Moscow and many of its European neighbours have also increased markedly amid the Russia-Ukraine war (see Figure 4). The incursion by around 20 Russian unmanned drones into Polish airspace in September 2025 that resulted in NATO forces shooting several of them down put the Western military alliance on high alert.
Our most likely scenario is that the Russia-Ukraine war rumbles on into its fifth year in its current form. However, there is a low probability scenario where Moscow’s persistent grey zone activities see it inadvertently escalate into a wider Russia-NATO conflict. Our team of analysts currently assigns a 6% probability to such an escalation by 24 February 2026. While low, this is the highest we’ve judged it to be since Moscow’s full-scale invasion in February 2022.
Rapidly changing world requires robust responses
As conflict continues to spread and intensify around the globe it leaves tragic levels of human suffering, population displacement and economic dislocation in its wake. The situation requires robust diplomatic and humanitarian responses from governments and multilateral organisations to mitigate the fallout.
The trend is also an increasing challenge for business leaders looking to shield their corporate staff and assets, supply chains, investments and underwriting portfolios. The shifting security landscape requires an agile response that draws on a comprehensive toolkit of country risk data, predictive analytics and foresight techniques such as scenario planning and horizon scanning to ensure they have the global insight they need to formulate risk management, supply chain and investment strategies that are resilient to the rising risk.